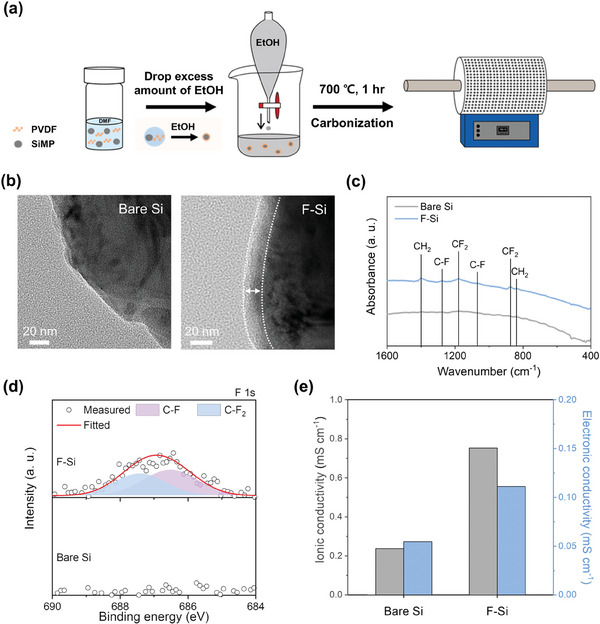
Figure 2.

Structural evolution of F‐Si. a) Schematic for the synthesis of F‐Si. b) Magnified TEM images of bare Si (left) and F‐Si (right). c) FT‐IR spectra and d) F 1s XPS spectra of bare Si and F‐Si. e) Ionic conductivity and electronic conductivity of bare Si and F‐Si electrodes.
