Figure 5.

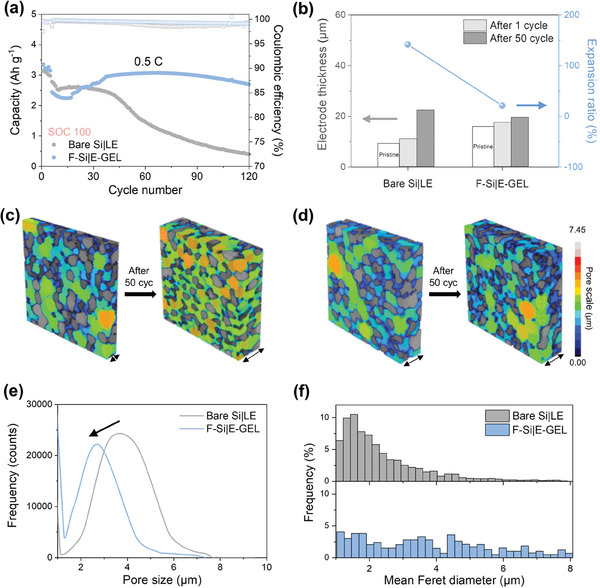
3D characterization illustrating the effect of covalent linkage. Cycle stability of a) bare Si|LE and b) F‐Si|E‐GEL cells at 0.5 C. b) Comparative analysis of the average change in electrode thickness for pristine and after 1, 50 cycles at 0.5 C (gray), and expansion ratio after 50 cycles compared to each pristine electrode (blue) based on SEM and X‐ray micro‐CT images. X‐ray micro‐CT images (blue scatter: average expansion ratio compared to each pristine electrode after 50 cycles) of c) bare Si and d) F‐Si electrodes in bare Si|LE and F‐Si|E‐GEL cells after 1 cycle (left), 50 cycles (right) at 0.5 C and corresponding e) pore size distribution and f) mean Feret diameter in each electrode.
