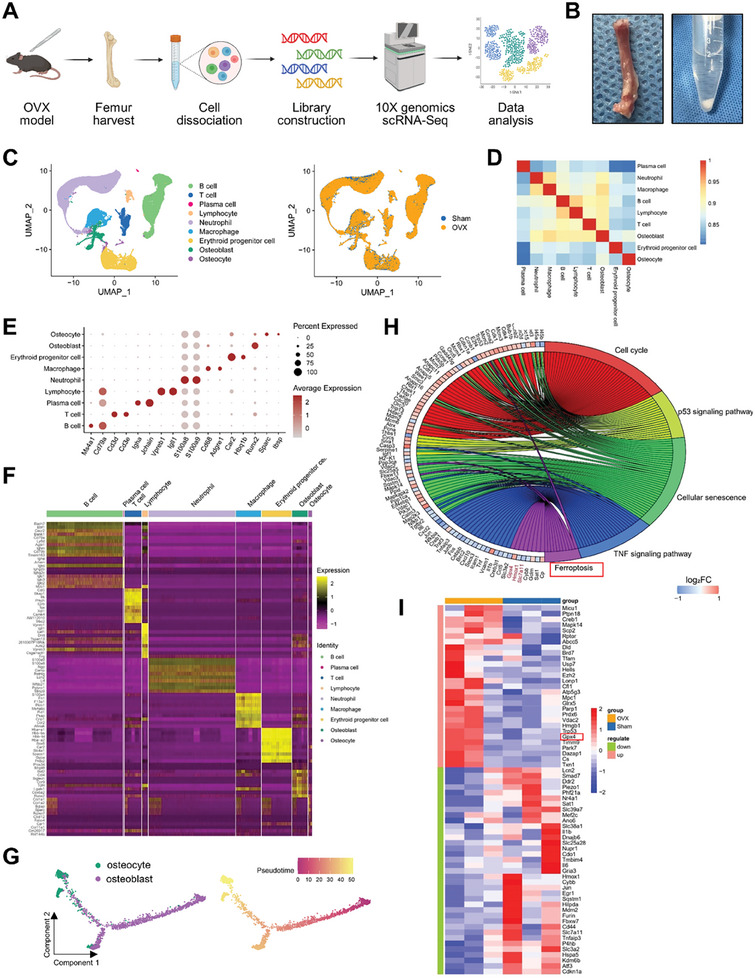
Figure 2.

Single‐cell sequencing of mouse femurs showed that osteocytes in OVX mice undergo ferroptosis. A) Schematic workflow of the experimental strategy. B) Photos of the process of harvesting mouse femur tissue and cell separation. C) UMAP dimensional reduction visualizations all samples. D) Heatmap showing the pairwise correlations. E) Dot plot showing the expression of specific signatures in identified cell types. F) Heatmap showing the top 10 marker genes for the various clusters. G) Monocle pseudotime trajectory analysis of the osteocyte and osteoblast subsets. H) KEGG enrichment analysis of differentially expressed genes in osteocytes in sham and OVX mice. I) Heatmap of differentially expressed ferroptosis‐related genes. Ferroptosis‐related genes were obtained from the FerrDb ferroptosis database.
