
Figure 4.
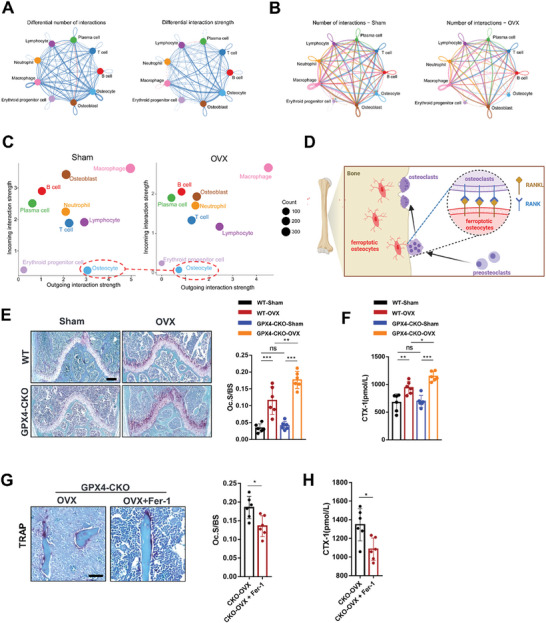
Ferroptosis of osteocytes leads to hyperactive osteoclastogenesis. A) Circle plots showing the differential number of interactions and differential interaction strengths of interactions in femurs between sham and OVX mice. B) Circle plots showing the numbers of interactions in each group. C) Bubble plot showing the incoming and outgoing interaction strength for each cell cluster in sham and OVX mice. D) Schematic showing osteoclastogenesis promotion by ferroptosis of osteocytes. E) Representative images of TRAP staining in the distal femoral metaphysis of mice in each group (scale bar, 200 µm). The osteoclast surface/bone surface (Oc.S/BS) values in the distal femurs of mice in each group (n = 6). F) Serum CTX‐1 levels of mice in each group (n = 6/group). G) Representative images of TRAP staining of trabecular bone in the distal femurs of the OVX‐Dmp1Cre; GPX4 fl/fl mice treated with and without Fer‐1 (scale bar, 50 µm) and quantification of the trabecular osteoclast surface to BS ratio (Oc.S/BS) (n = 6/group). H) Serum CTX‐1 levels of the OVX‐Dmp1Cre; GPX4 fl/fl mice treated with and without Fer‐1 (n = 6/group). GPX4‐CKO: Dmp1Cre; GPX4 fl/fl mice. Data are represented as the mean ± SD. *P < 0.05, **P < 0.01, ***P < 0.001, ns = not significant. Two‐tailed Student's t test.