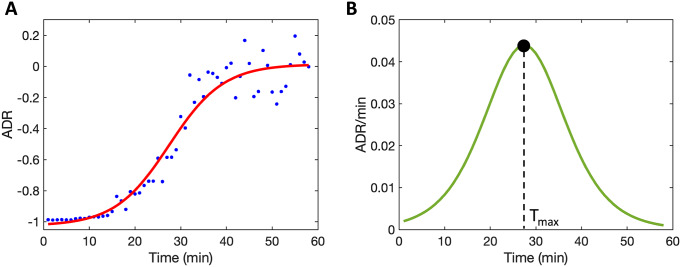
Figure 1.
Restoration of the postictal electroencephalogram (EEG) expressed as the evolution of the normalized alpha–delta ratio (ADR; equation 1). (A) Averaged ADR values per minute (blue dots) followed a typical sigmoidal evolution in the postictal state, starting at values close to −1. The evolution of ADR is well described by the sigmoidal curve (solid red line), defined by equation 2. Here,
 = 1.0 ± 0.1 (
 ADR) and
 = 5.9 ± 4.4 min. (B) From the derivative (green solid line), defined by equation 3, Tmax is estimated. Here, Tmax = 27 min. These data are from subject 2 in this study.

