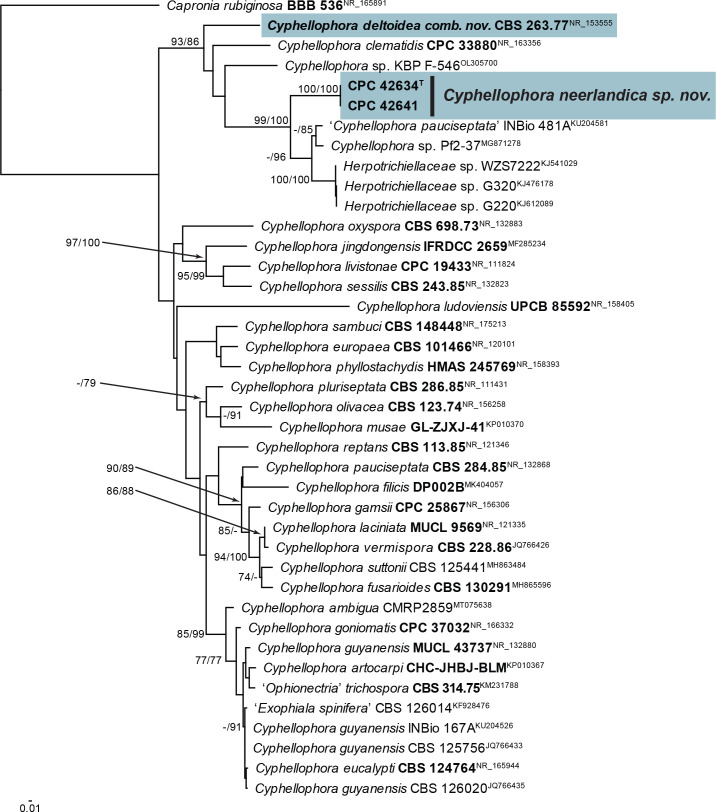
Fig. 14.
Consensus phylogram (50 % majority rule) obtained from the maximum likelihood analysis with IQ-TREE v. 2.1.3 of the Anthopsis / Cyphellophora ITS nucleotide alignment. Maximum likelihood (> 74 %) and maximum parsimony (> 74 %) bootstrap support values from 1 000 non-parametric bootstrap replicates are shown at the nodes. Culture collection or voucher numbers and GenBank accession numbers (superscript) are indicated for all species. Sequences derived from material with a type status are indicated with a culture or voucher number highlighted with bold face. The tree was rooted to Capronia rubiginosa (culture BBB 536; GenBank NR_165891) and the species treated here is highlighted with bold face. The scale bar indicates the expected number of changes per site.

