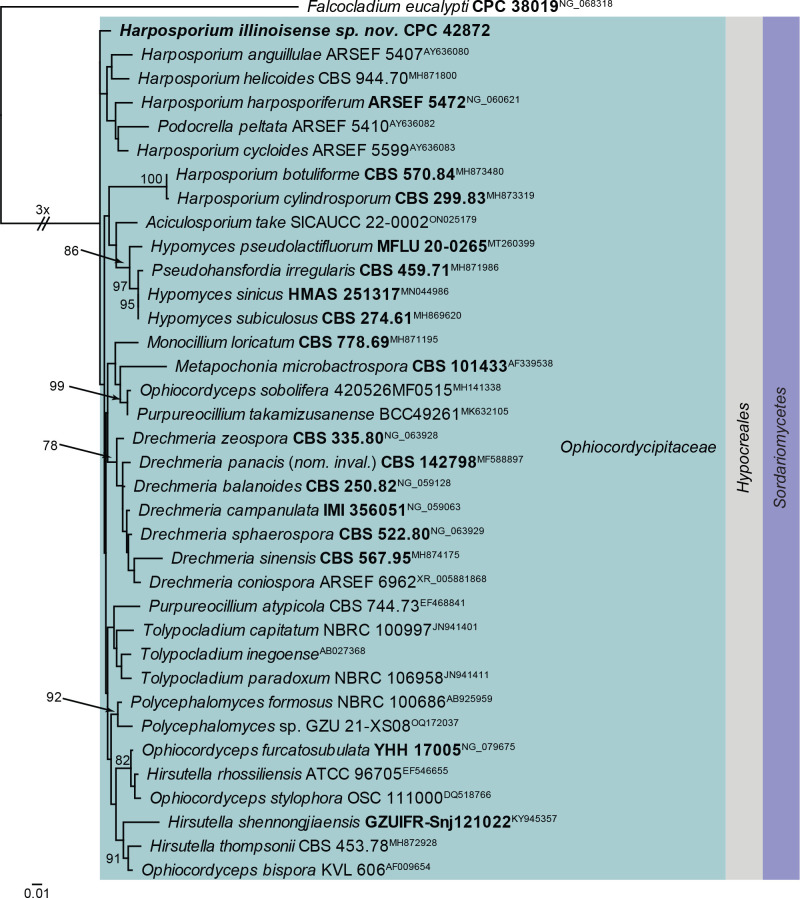
Fig. 23.
Consensus phylogram (50 % majority rule) obtained from the maximum likelihood analysis with IQ-TREE v. 2.1.3 of the Ophiocordycipitaceae LSU nucleotide alignment. Bootstrap support values (> 75 %) from 1 000 non-parametric bootstrap replicates are shown at the nodes. Culture collection or voucher numbers and GenBank accession numbers (superscript) are indicated for all species. Sequences derived from material with a type status are indicated with a culture or voucher number highlighted with bold face. The tree was rooted to Falcocladium eucalypti (culture CPC 38019; GenBank NG_068318) and the species treated here is highlighted with bold face. The family, order and class are shown in coloured blocks to the right of the tree. The scale bar indicates the expected number of changes per site.

