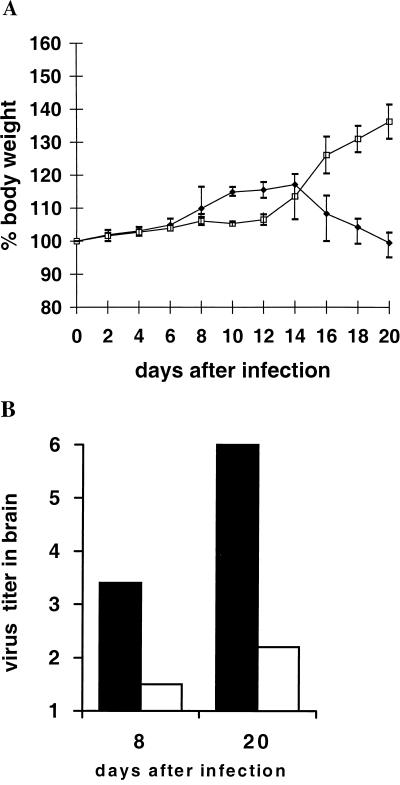
FIG. 1.
Transfusion of CD4+ T-cell line at days 12 (5 × 10⁵) and 2 (2 × 10⁶) before BDV infection. (A) Body weight curves for T-cell-treated rats (□) and untreated control rats (⧫). (B) Virus titers (mean of values listed in Table 1) for T-cell-treated rats (□) and untreated control rats (▪). Virus titers are given as log10.

