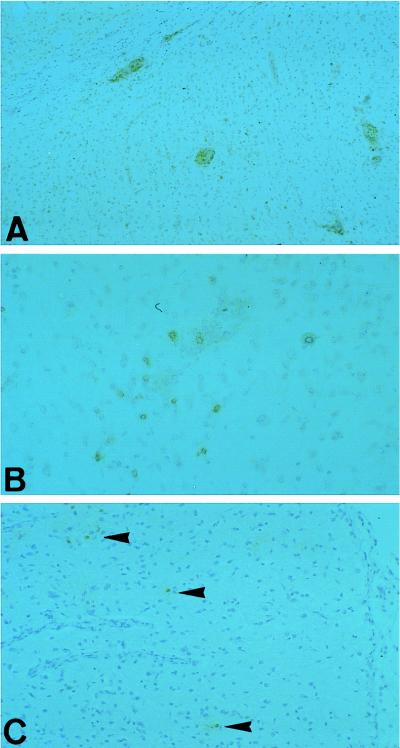
FIG. 5.
Presence and localization of T-cell populations in CD4+ T-cell-treated rats: perivascular distribution of CD4+ T cells (A, day 10) and dissemination of CD8+ T cells (B and C) in the brains of T-cell-treated rats. Note the difference in the numbers of CD8+ T cells at day 10 (B) and day 20 (C). In infected control rats, very few cells are found at day 10 (data not shown). Magnifications: A, ×50; B, ×10; C, ×60.

