Fig. 1.
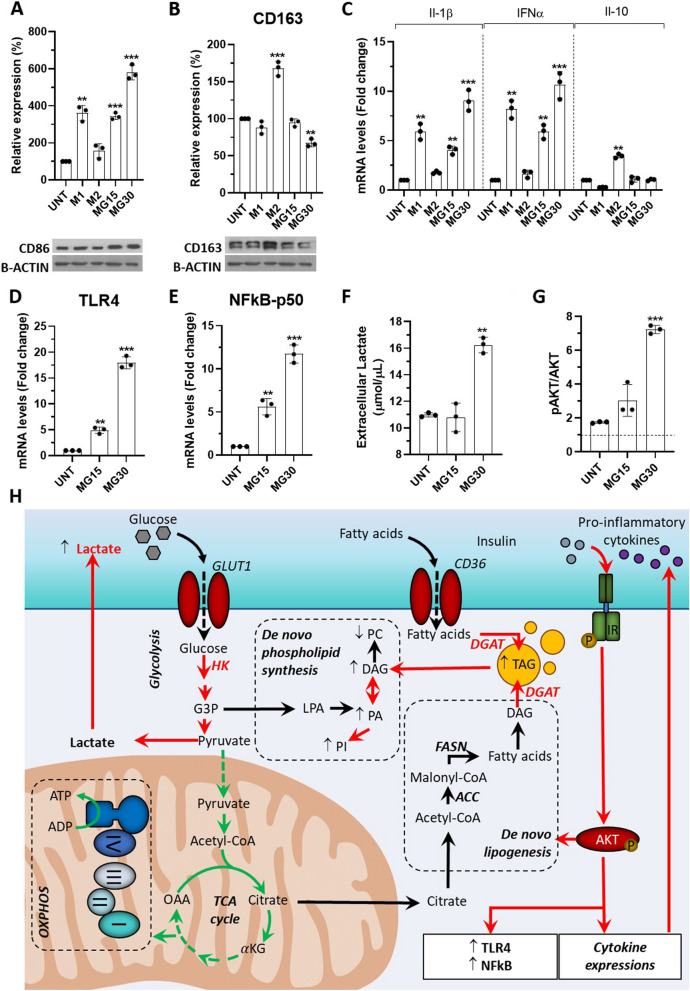
High-glucose induced M1 markers and cytokine production in macrophages. A-B Protein levels of CD86 and CD163 determined by WB. UNT=untreated macrophages, MG15= 15mM glucose, MG30= 30mM glucose. C mRNA levels of Il-1β, IFNα and Il-10. M1=THP-1-derived macrophages treated with IFNγ and lipopolysaccharide (LPS) were used as a positive control of M1 polarization, M2=THP-1-derived macrophages treated with IL-4, used as a positive control of M2 polarization. D toll-like receptor 4 (TLR4) and (E) subunit p-50-nuclear factor kappa-light-chain-enhancer of activated B cells (p50-NFkB) in macrophages. All RT-PCR data normalized to glyceraldehyde 3-phosphate dehydrogenase (GAPDH) mRNA level, then expressed as fold changes of untreated macrophages. F Lactate concentration in the macrophage-conditioned medium. G WB of phospho AKT in response to insulin, normalized to total AKT. H Summary of the effect of glucose treatement on macrophage lipid metabolism. In red, the reactions that are up-regulated and in green, the reactions that are down-regulated, in a glucose dependent manner, and validated in this study values are means ± SD (n = 3); p values are from student t-test (treated vs untreated), (*) p<0.05, (**) p<0.01, (***) p<0.001. ACC: acetyl-CoA carboxylase; aKG: α-ketoglutaric acid; AKT: protein kinase B; ADP: adenosine diphosphate; ATP: adenosine triphosphate; CD36: Cluster Determinant 36; DAG: diacylglycerol; DGAT: diacylglycerol acyltransferase 1/2; FASN: fatty acid synthase; G3P: glyceraldehyde 3 phosphate; GLUT1: glucose transporter 1; HK: hexokinase; IR: insulin receptor; LPA: lysophosphatidic acid; OAA: oxaloacetic acid; PA: phosphatidic acid; PC: phosphatidylcholine; PI: phosphatidylinositol; TAG: triacylglycerol; TCA: tricarboxylic acid

