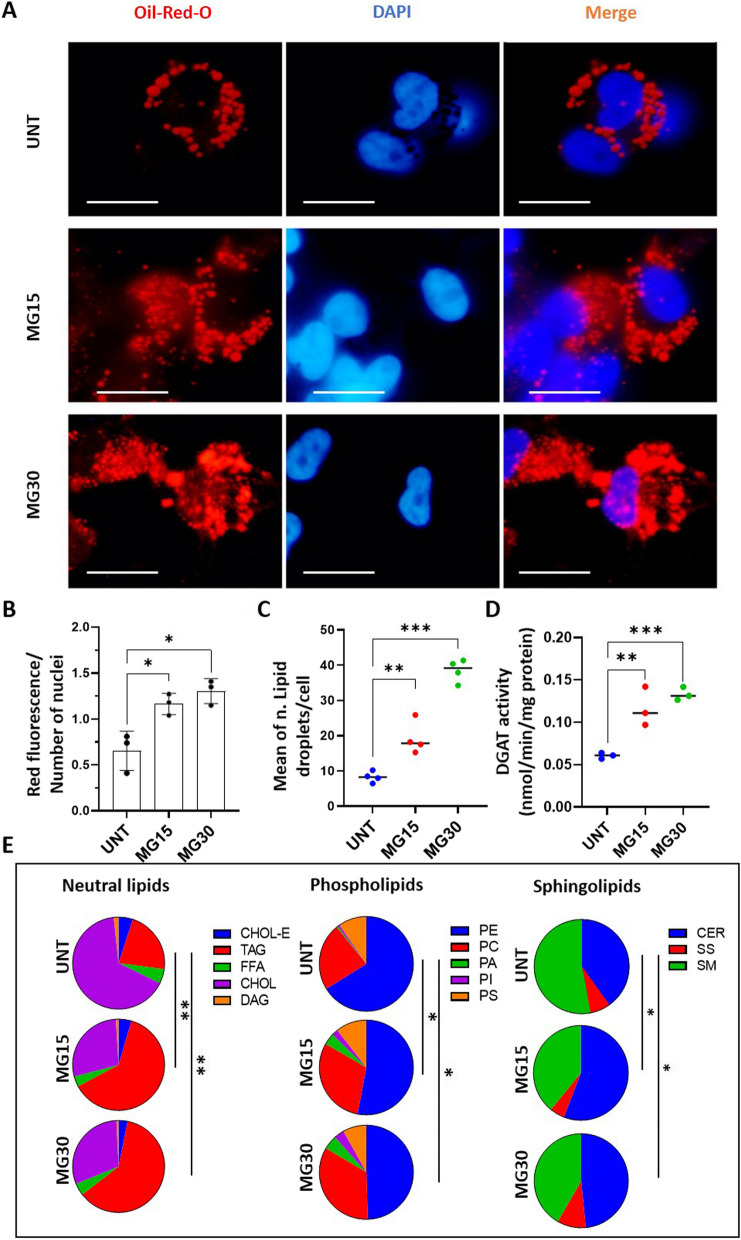
Fig. 2.
High-glucose concentrations modified macrophage lipid distribution. A Oil-red oil and DAPI staining of untreated macrophages (UNT) and MG15 and MG30 macrophages (scale bar=10mm). B Quantification of fluorescence intensity normalized to the number of nuclei. Three 3 images were taken per replicate and each dot in the graph is the mean these 3 image counts. C Number of lipid droplets per cells (n = 4), determined according to [32]. D Quantification of DGAT activity by using radio-labelled substrated. E Distribution of neutral lipids, phospholipids, and sphingolipids in untreated macrophages (UNT), and in MG15 and MG30 macrophages. Data are expressed as % of total lipids. Significantly different lipid distributions were identified with chi-squared tests. CHOL-E: cholesterol ester; TAG: triacylglycerol; FFA: free fatty acid; CHOL: cholesterol; DAG: diacylglycerol; PE: phosphatidylethanolamine; PC: phosphatidylcholine; PA: phosphatidic acid; PI: phosphatidylinositol; PS: phosphatidylserine; CER: ceramide; SS: sphingosine; SM: sphingomyelin; DGAT: diacylglycerol acyltransferase

