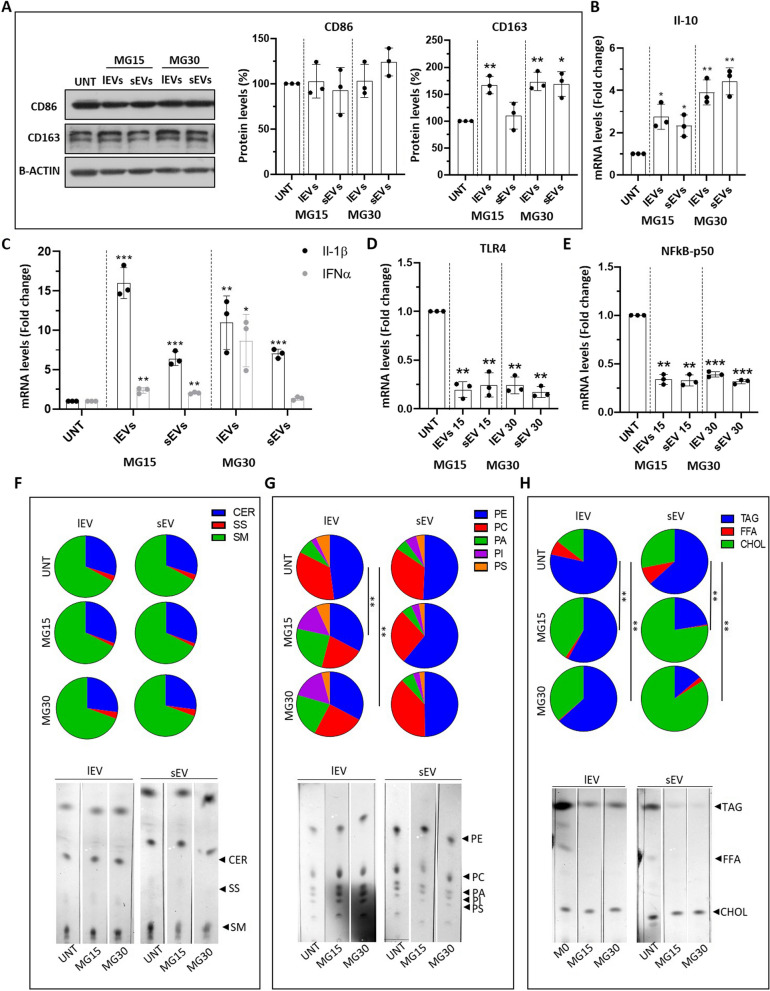
Fig. 4.
EVs from HG-treated macrophages affect macrophage polarization and lipid composition. A Quantification of CD86 and CD163 by WB. mRNA levels of interleukin 10 (Il-10) (B), interleukin 1β (Il-1β) interleukin 6 (Il-6), interferon α (INFα) (C), toll-like receptor 4 (TLR4) (D), and subunit p-50-nuclear factor kappa-light-chain-enhancer of activated B cell (p50-NFkB) (E), in macrophages treated with lEVs and sEV released from MG15 and MG30 macrophages. Data are normalized to glyceraldehyde 3-phosphate dehydrogenase (GAPDH) mRNA level and expressed as control. Values are means ± SD (n = 3); p values are from student t-test (EV treated vs untreated), (*) p < 0.05, (**) p< 0.01, (***) p< 0.001. (F) % of neutral lipids, (G) phospholipids and (H) sphingolipids in EV-treated macrophages. Significant distributions were identified by a chi-squared test. CER: ceramide; SS: sphingosine; SM: sphingomyelin; PE: phosphatidylethanolamine; PC: phosphatidylcholine; PA: phosphatidic acid; PI: phosphatidylinositol; PS: phosphatidylserine; TAG: triacylglycerol; FFA: free fatty acid; CHOL: cholesterol

