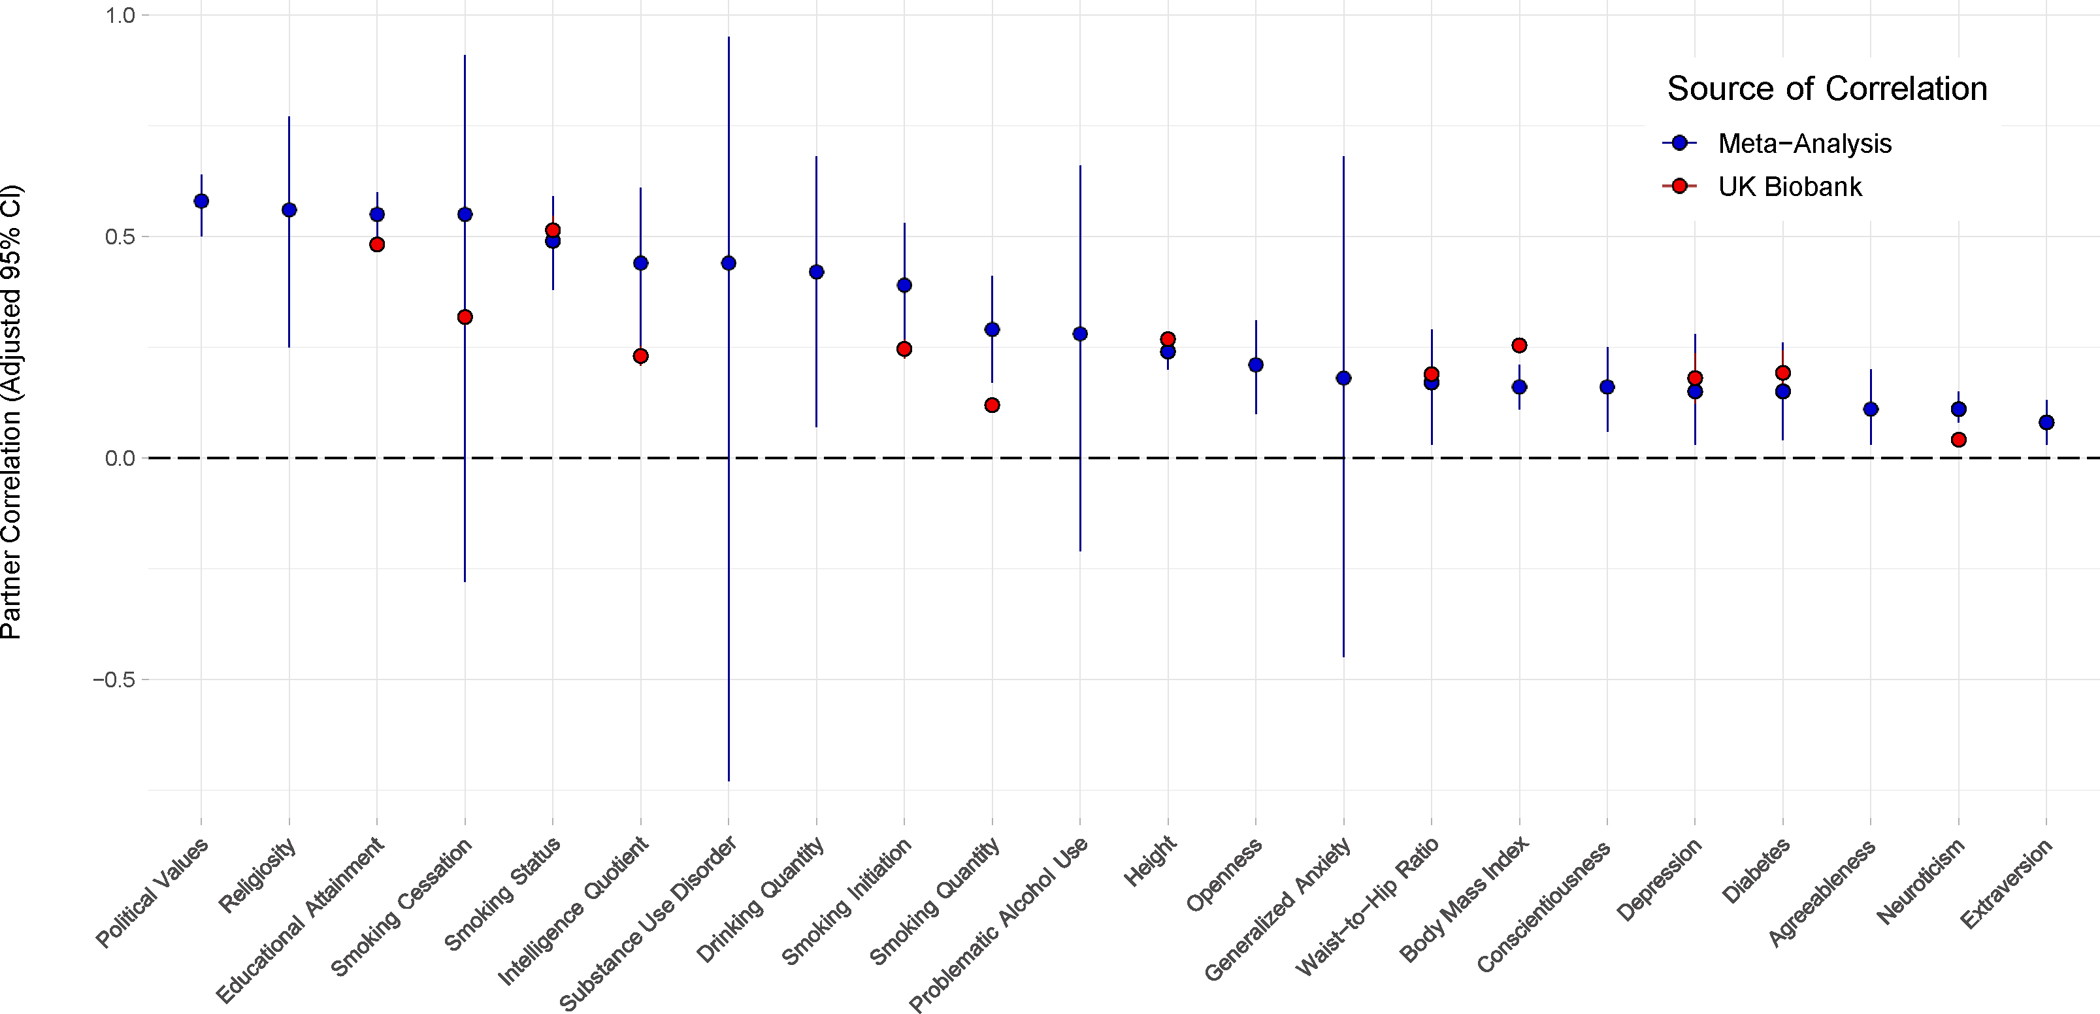
Figure 1: The point estimates of the mean meta-analyzed random effects partner correlations and UK Biobank partner correlations for comparable traits, along with their respective Bonferroni-adjusted 95% confidence intervals.

The dark blue points represent the random effects estimates of the mean meta-analyzed correlations for partners, while the red points on the same vertical axis represent the point estimates of the partner correlations for a comparable trait in the UK Biobank, where applicable. To account for multiple testing, meta-analyzed and UK Biobank correlations are shown with Bonferroni-adjusted 95% confidence intervals (adjusting for 22 and 133 traits, respectively). Table 1 and Supplementary Table 4 include the precise sample size and point estimate/adjusted confidence interval/adjusted p-value, etc. for each of these traits in the meta-analysis and UK Biobank, respectively.
