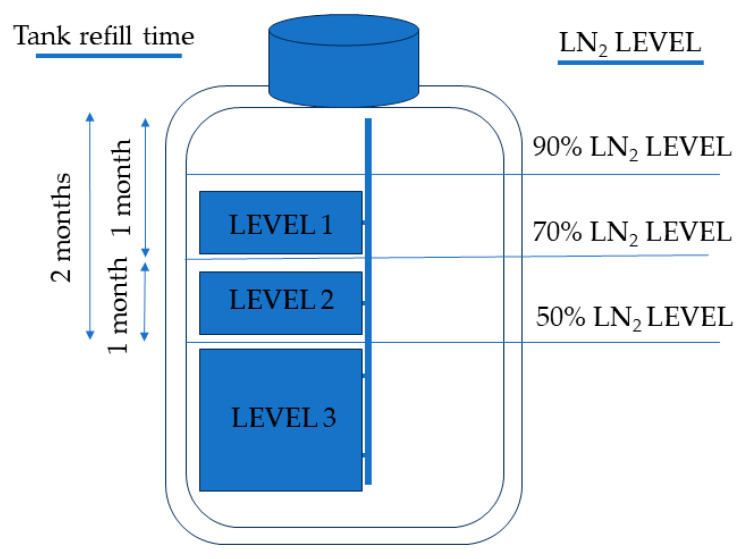
Figure 1.
The diagram illustrates the relationship between the liquid nitrogen (LN2) levels in the storage tank and their corresponding storage levels. It also provides information regarding the frequency of tank refilling and the duration for which the straws were submerged in LN2. This graphical representation summarizes how the LN2 levels fluctuated in correlation with the storage levels and the specific intervals at which the tank required replenishment.

