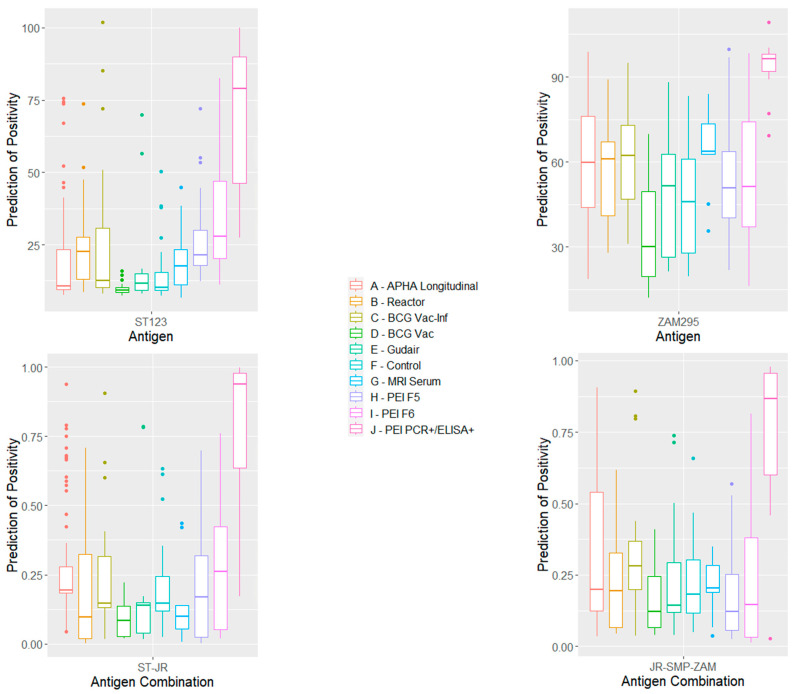
Figure 2.
Box-and-whisker plots of the distribution of antigen responses with each cohort of MAP-negative samples and PEI++ samples (positive to PCR and IDEXX) to individual antigens ST123 and ZAM295, together with those to combinations of antigens ST123/JRRR121 and JRRR121/SMP70/ ZAM295 using the R statistics package. A–J refer to columns from left to right.

