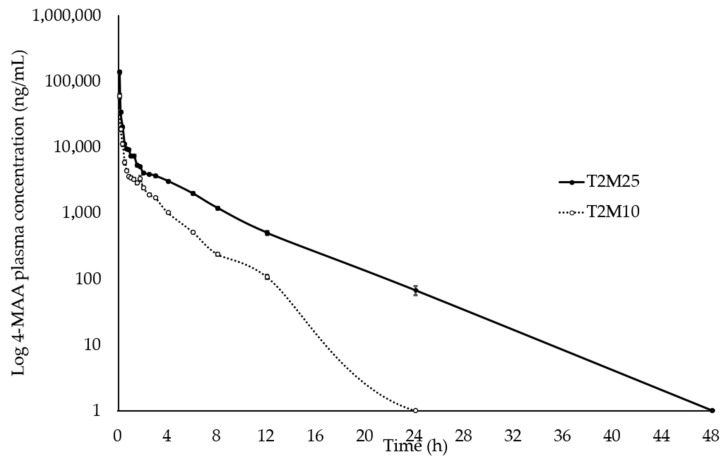
Figure 3.
Log10 plasma concentration vs. time for N-methyl-4-aminoanthypyrine (MAA) following intravenous administration of metamizole (25 mg∙kg−1 and 10 mg∙kg−1) and tramadol (2 mg∙kg−1) in ten healthy northeastern Brazilian donkeys. Notes: Black circles (•) represent the mean and standard deviation results of the group treated with 2 mg∙kg−1 tramadol and 25 mg∙kg−1 metamizole; white circles (◦) indicate the mean and standard deviation of the group treated with 2 mg∙kg−1 tramadol and 10 mg∙kg−1 metamizole.

