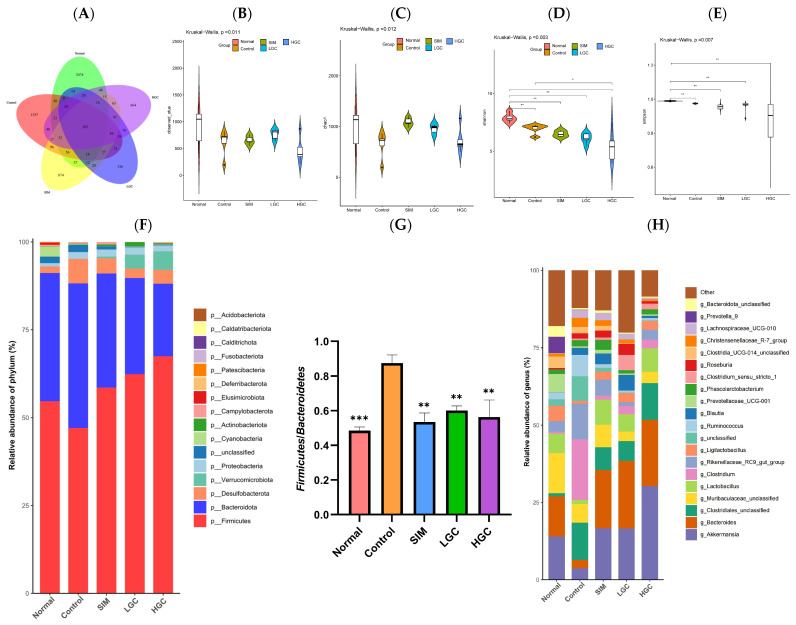
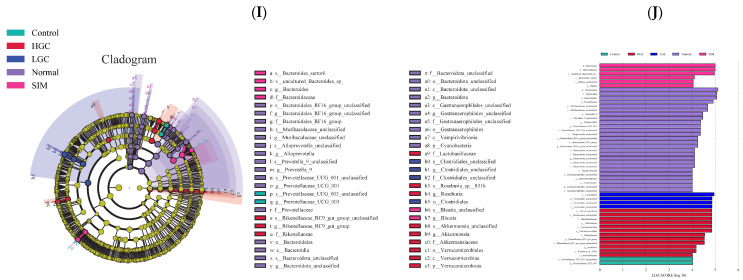
Figure 5.
The impact of GC on the diversity and composition of gut microbiota in HFD rats. (A) Venn diagram of microflora differences between groups. (B) Observed OTU. (C) Chao1 index. (D) Shannon index. (E) Simpson index. (F) Phylum level. (G) Abundance ratio of Firmicutes/Bacteroidetes. (H) Genus level. (I) Taxonomic cladogram obtained from LEfSe analysis. (J) LEfSe analysis identified the microbiota phylotypes with the statistical difference in abundance among groups. SIM, LGC, HGC vs. Control, * p < 0.05, ** p < 0.01, *** p < 0.001.


