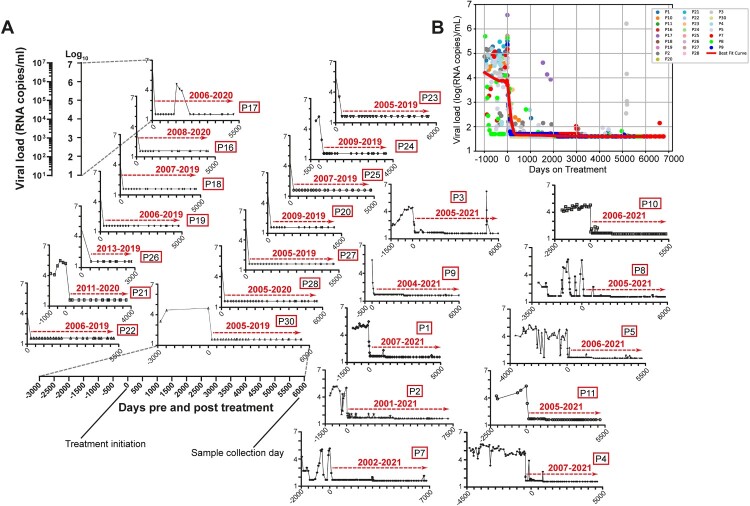
Figure 1.
Viral load graphs of some of the tCHI participants in this study. (A) Individual participant tracking shown. P12, P13, P14, and P15 received stable cART for less than two years at the time of sample collection. P6, P29, P31, and P32 had intermittent tracking of viral load during the course of their 225, 4221, 2889, and 2581 days on treatment, respectively. Graphs for these participants are not shown. (B) One cumulative overlay of the participants graphed in Panel A, best fit curve was constructed using LOWESS smoother by statsmodels v.0.15.0.

