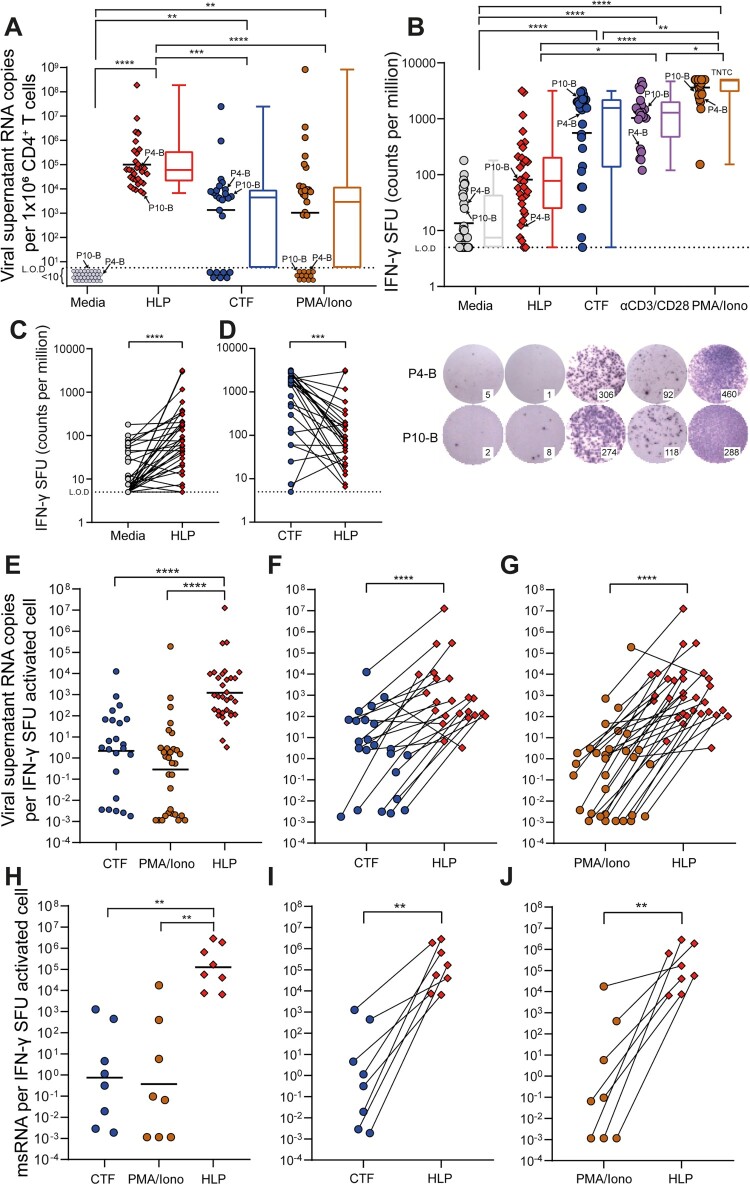
Figure 2.
HLP_B induces potent latency reversal in CD4+ T cells from tCHI. Latency reversal assay was conducted using HLP, CTF, αCD3/CD28, and PMA/Iono. (A) Viral copy number was determined via qRT-PCR from culture supernatants (geometric mean shown for scatter, median is shown for box–whisker plots). (B) IFN-γ was measured via ELISpot (geometric mean shown for scatter, median for box–whisker). ELISpot wells were shown and purple dots are spot forming units (SFU), from participant 4 and 10 with subtype B infection. Raw SFU counts used 1 or 2 × 10⁵ cells/well, and were presented in the graph adjusted to 1 × 10⁶ cells/mL for consistency to assay for viral release analysis in Panel A. Next, intra-donor comparison for T cell activation by IFN-γ ELISpot was analyzed between HLP and (C) Media or (D) CTF. (E) The ratio of HIV vRNA copies per IFN-γ activated cell from culture supernatants was calculated (geometric mean), with intra-donor pairwise alignment comparison between HLP and either (F) CTF or (G) PMA/Iono. (H) The ratio of HIV msRNA copies per IFN-γ activated cell from infected cells was calculated, with intra-donor pairwise alignment comparison between HLP and either (I) CTF or (J) PMA/Iono. Each pair of datapoints connected by a line is from one donor. Kruskal–Wallis with Dunn’s post-hoc tests were performed to account for inter-sample multiple comparisons, and two-tailed Wilcoxon matched-pairs signed rank tests were performed for intra-sample significance. Paired comparisons between every condition were performed, only the statistically significant comparisons are denoted. *p < 0.05, **p < 0.01, ***p < 0.001, ****p < 0.0001; L.O.D, limit of detection; SFU, spot forming units; msRNA, multiply-spliced RNA; TNTC, too numerous to count.

