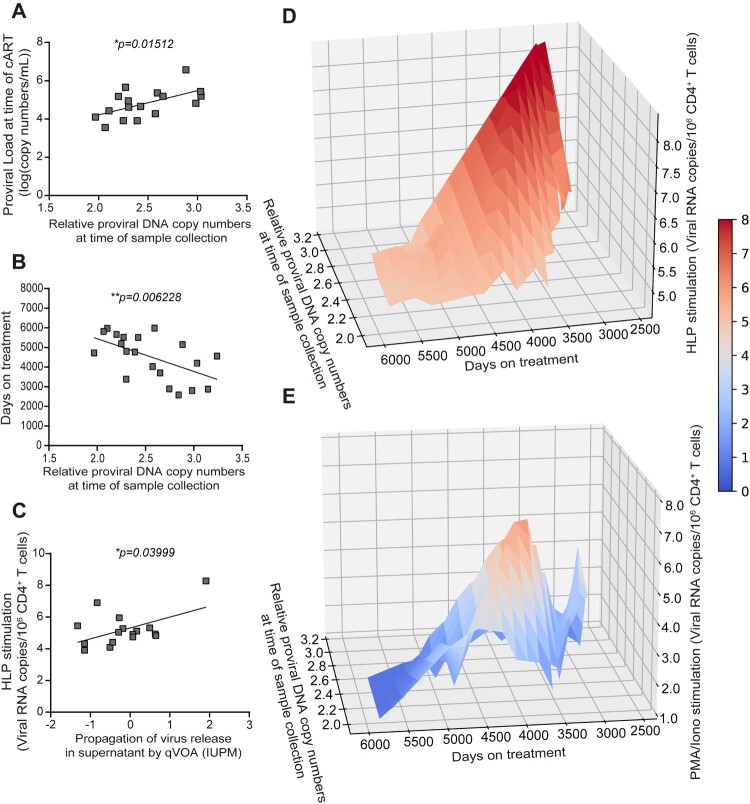
Figure 6.
Correlation analysis between proviral load, propagation of virus release in supernatant by qVOA (IUPM), and viral copies in supernatant stimulated by HLP measured by qRT-PCR. (A) Correlation between proviral load at the time point starting combination anti-retroviral treatment (cART) and proviral load at sample collection. (B) Correlation between proviral load at sample collection and time of cART treatment (days). (C) Correlation between viral RNA copies in culture supernatant from latency reversal assay by HLP and measured by qRT-PCR, and a quantitative viral outgrowth assay (qVOA) used a limiting dilution of primary T cells co-cultured with MOLT-4/CCR5 cells to stimulate those cells harbouring latent HIV to propagate further infection, an amount that was expressed as IUPM, infectious units per million cells. Each datapoint represents one donor. (D) A 3D correlation was mapped comparing time of treatment (days) and proviral DNA copy numbers at time of sample collection and viral RNA copies in culture supernatant from latency reversal assay by HLP and measured by qRT-PCR. (E) A 3D correlation was mapped comparing time of treatment (days) and proviral DNA copy numbers at time of sample collection and viral RNA copies in culture supernatant from latency reversal assay by PMA/Iono and measured by qRT-PCR. Colour bar corresponds to the z-axis. A two-tailed Pearson Correlation Coefficient test was used to assess significance (*p < 0.05; **p < 0.01). HLP, HIV-1/virus-like particle.

