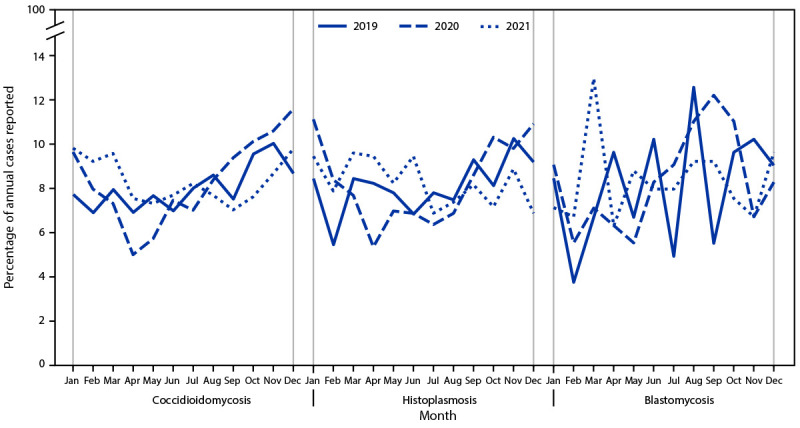
FIGURE.

Percentage of reported annual coccidioidomycosis, histoplasmosis, and blastomycosis cases,* by month of report — United States, 2019–2021
* Denominator is the total number of cases reported in each year (2019, 2020, and 2021) with a known earliest recorded event month for each fungal disease.
