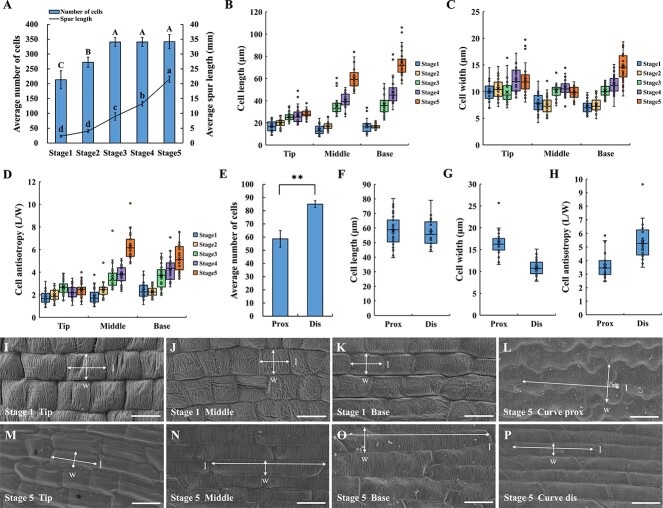
Figure 2.
The variation in cell number and cell morphology during spur development. (A) Spur length and cell number at five developmental stages, counting cells from the base to the tip of the proximal outer epidermis. (B–D) Cell length (B), width (C), and anisotropy (D) at five developmental stages, measured at the tip, middle, and base of the spur. (E–H) Cell number (E), length (F), width (G), and anisotropy (H) on the proximal (prox) and distal (dis) sides of the spur curve in stage 5, with epidermal cells counted and measured within a 5.2 mm range of the curved part. (I–K) Cell morphology at the tip (I), middle (J), and base (K) of the spur in stage 1. (L) Morphology of cells on the proximal (prox) side of the spur curve in stage 5. (M–O) Cell morphology at the tip (M), middle (N), and base (O) of the spur in stage 5. (P) Morphology of cells on the distal (dis) side of the spur curve in stage 5. Error bars represent ± SD in (A) and (E) (n = 3). Different letters in (A) indicate statistically significant differences (Tukey’s test: α = 0.05). Asterisks in (E) indicate a significant difference relative to the proximal side (t test: **P < 0.01). Data for (B–D) and (F–H) are from three biological replicates, with 10 replicates taken for each biological replicate. Horizontal and vertical lines in (I–P) indicate cell length (l) and width (w), respectively. Bars = 10 μm in (I–K). Bars = 20 μm in (L–P).

