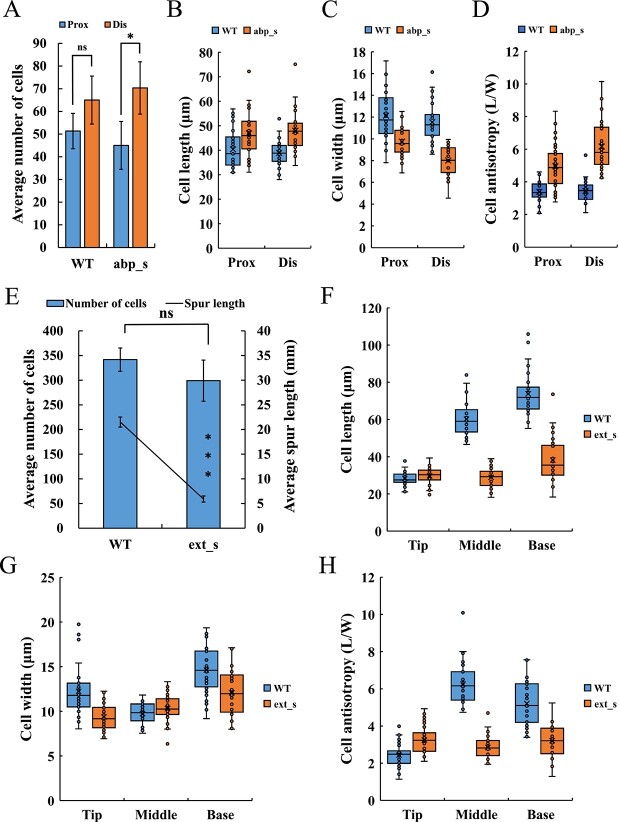
Figure 5.
Cell number, length, width, and anisotropy of silenced spurs. (A–D) Number (A), length (B), width (C), and anisotropy (D) of the proximal (prox) and distal (dis) cells of abp_s spurs’ curve compared with those of WT. Epidermal cells within 1.3 mm range of the curved part were counted and measured. (E–H) Cell number (E), length (F), width (G), and anisotropy (H) of ext_s spurs compared with those of WT. Cells were counted along a single line from the base to the tip of the proximal outer epidermis, and the tip, middle, and base of the spur were measured. Error bars in (A) and (E) represent ± SD (n = 3). Asterisks in (A) and (E) indicate a significant difference (t test: *P < 0.05; ns, not significant). The data for (B–D) and (F–H) came from three biological replicates, with 10 replicates taken for each biological replicate.

