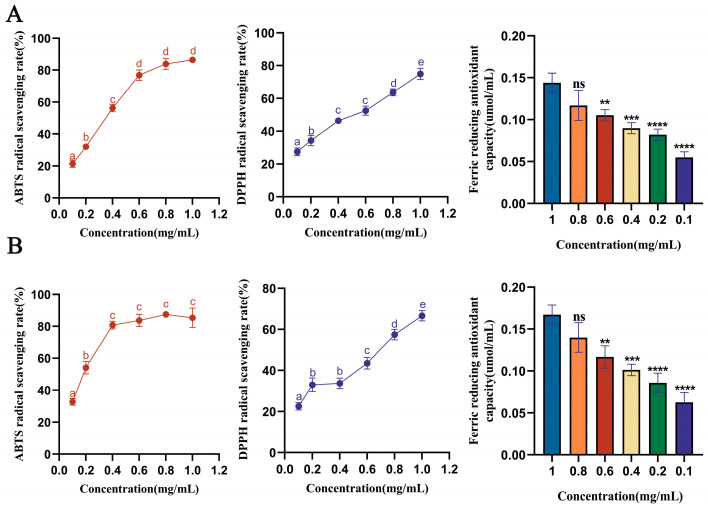
Figure 3.
Determination of the antioxidant activities of stigma peptides. (A) ABTS, DPPH, and FRAP of DGGSDYLGK. (B) ABTS, DPPH, and FRAP of VDPYFNK. Reported values show means and standard deviations over three biological replicates. a–e Values with the same letters indicate no significant difference for the different concentrations (p < 0.05): ** p < 0.01, *** p < 0.001, and **** p < 0.0001, different synthetic peptide concentration groups vs. the model group. Using the SPSS statistical software, the data were analyzed using a two-way ANOVA.

