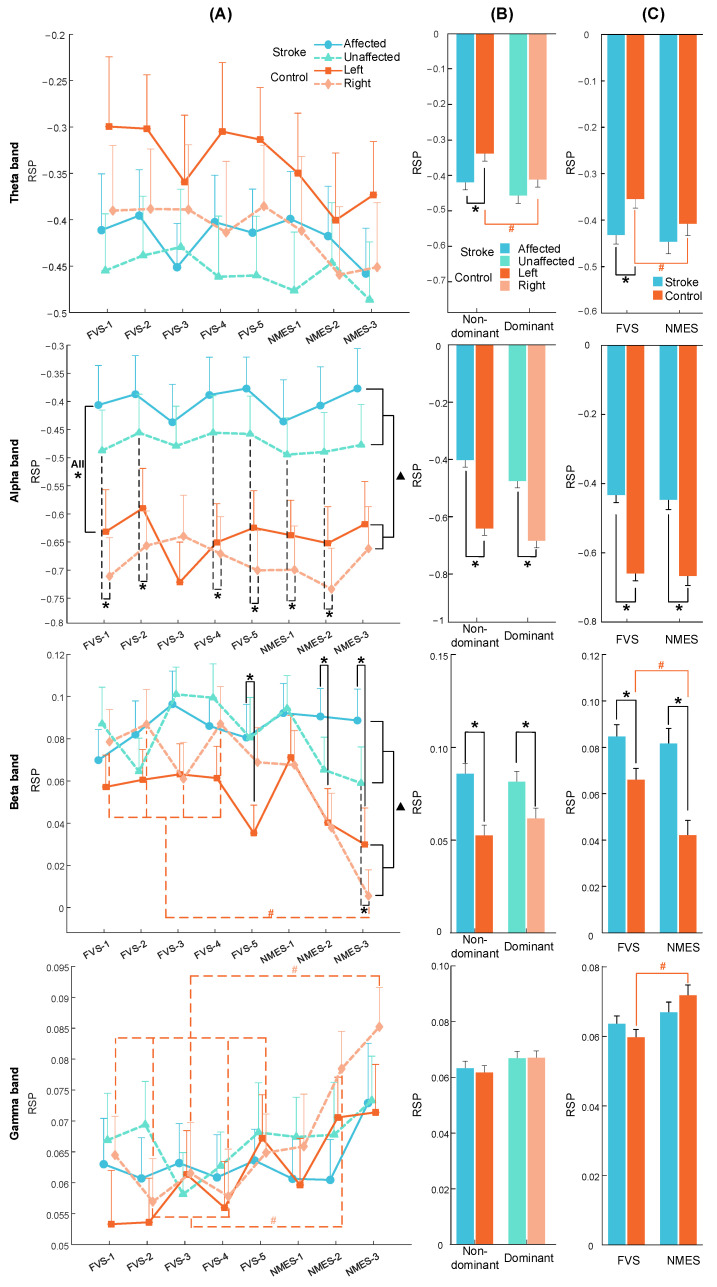
Figure 6.
RSP averaged across subjects on the contralateral sensorimotor cortex in the theta, alpha, beta, and gamma bands during the period of interest. The RSP values are presented as the mean with SE (error bar). RSP comparison with respect to (A) the stimulation scheme, target arm, and group. Significant intra-group differences between schemes are indicated by “#” (p < 0.05, one-way ANOVA repeated measures with Bonferroni post hoc tests). Overall significant inter-group differences are indicated by “▲” (p < 0.05, two-way mixed ANOVA). Significant inter-group differences based on target arm are indicated by “*” (p < 0.05, independent t-test). RSP comparison with respect to (B) the target arm and group and (C) the stimulation type and group. Significant intra- and inter-group differences are indicated by “#” and “*” (p < 0.05, paired and independent t-test), respectively.

