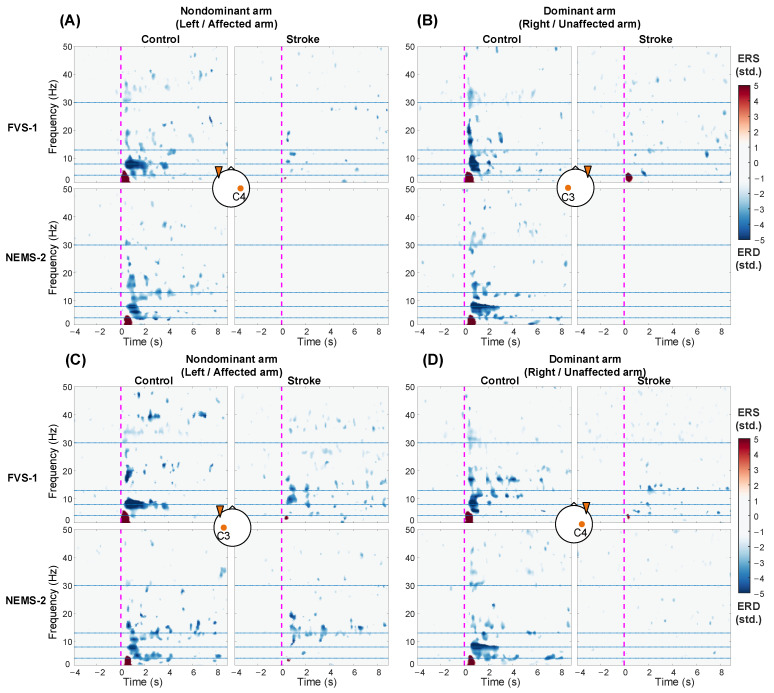
Figure 7.
ERSP averaged across subjects in the C3/C4 channel contralateral (A,B) and ipsilateral (C,D) to the stimulated arms during representative FVS and NMES. The blue and red color schemes denote the ERD and ERS, respectively. Significant ERD/ERS in comparison with the resting baseline (p < 0.05, baseline permutation statistical method with false discovery rate correction). The vertical dashed magenta lines at 0 s mean the onset of stimulations. The horizontal dotted blue lines show the frequency band boundaries at 4, 8, 13, and 30 Hz. The brain icon at the center of each subfigure shows the stimulated nondominant/dominant arm by the orange triangle on one side and the observed contralateral or ipsilateral channel by the C3/C4 label.

