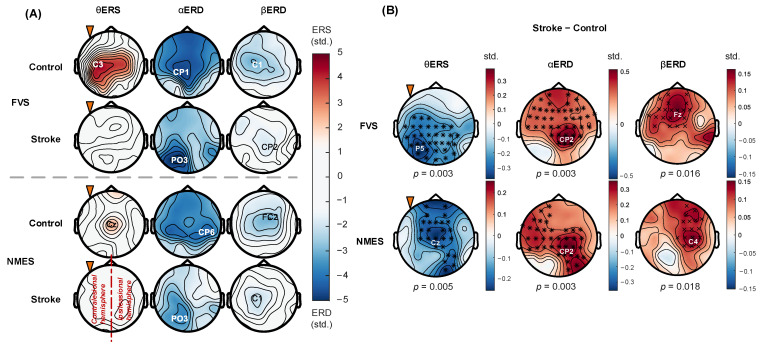
Figure 8.
(A) ERD/ERS topographies when stimulating the nondominant arm. The blue and red color schemes denote the ERD and ERS, respectively. Peak channels are indicated by the labels. (B) Differences in topography between stroke and control groups. The blue and red color schemes denote the negative or positive differences, respectively. Significant differences between stroke and control groups are indicated by “×” for p < 0.05 and “*” for p < 0.01 (cluster-based permutation test). The orange triangle indicates stimulating the nondominant (left/affected) arms. The right hemisphere is ipsilesional for the stoke group.

