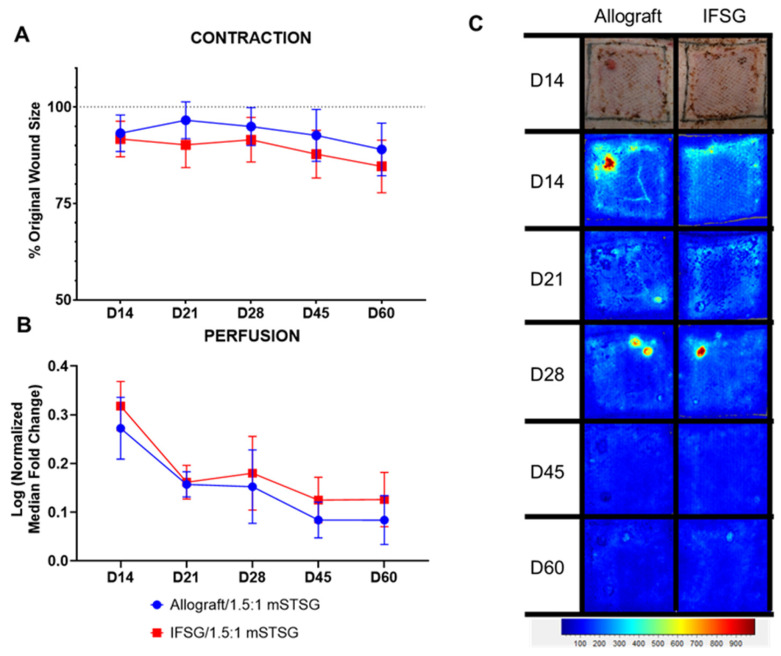
Figure 5.
Contraction and laser speckle imaging. (A) Wound contraction was calculated by tracing the tattoos, compared to the initial wound size, and normalized to the growth of each animal. The wound size on day 0 is represented by the dotted line. If contraction occurred during healing, a decrease in the % original wound size would be observed. No significant differences comparing the groups at each time point were detected by 2-way repeated-measures ANOVA with Sidak’s post hoc test. (B) Laser speckle imaging was used to measure the perfusion in the wounds. A fold change was calculated by dividing the wound perfusion by the local background perfusion. The perfusion within the growth control regions was used for normalization for each time point. The normalized median fold change was log transformed in order to pass the Shapiro–Wilk normality test. No significant differences comparing the groups at each time point were detected using two-way repeated-measures ANOVA with Sidak’s post hoc test. The median with 95% confidence intervals is represented in the figure; N = 10 (IFSG); 12 (allograft). (C) One wound is depicted for each group throughout the study. A day-14 digital image is shown with the longitudinal LSI images. At the bottom is the heatmap scale that defines blue as low perfusion and red as high perfusion. Normal uninjured skins’ baseline perfusion is blue. By the day 60 end-point, the wound edges are no longer obvious, suggesting a return to normal perfusion levels. IFSG = intact fish skin graft.

