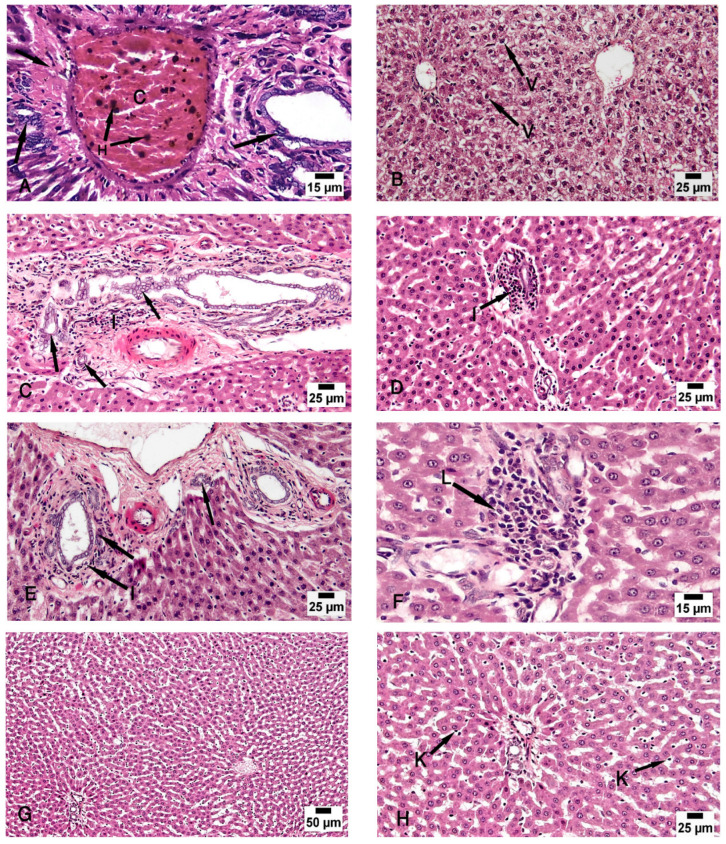
Figure 4.
Photomicrographs of the liver tissue. (A) Group II shows periportal fibroplasia, bile duct dilatation and hyperplasia (arrow), and congested (C) portal vein with hemosiderosis (H). (B,C) Group III shows moderate vacuolar degeneration of the hepatocytes (V) and bile duct dilatation and hyperplasia (arrow) with minimal inflammatory cellular infiltration (I). (D) Group IV shows normal hepatocytes with minimal periportal inflammatory cellular infiltration (I). (E,F) Group V shows minimal bile duct dilatation and hyperplasia (arrow), minimal inflammatory cellular infiltration (I), and periportal leukocytic infiltration (L). (G,H) Group VI shows normal hepatocytes and Kupffer cells (K). (H & E; (A,F) ×200; (B–E,H) ×400; (G) ×100).

