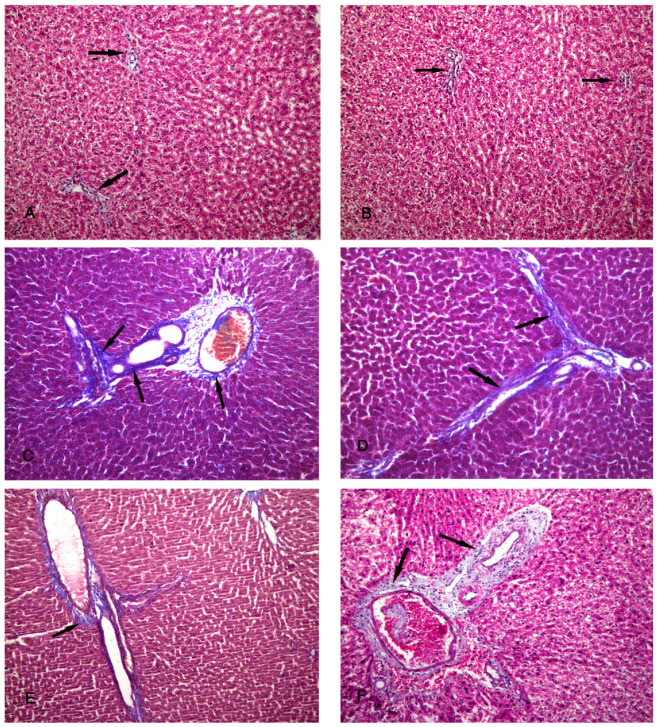
Figure 5.
Photomicrographs of the liver tissue. (A,B) Group I shows a minimal amount of collagen fibers around the periportal area (arrows). (C,D) Group II shows an increased amount of collagen fibers around the periportal area (arrows). (E,F) Group III shows a moderate amount of collagen fibers around the periportal area (arrows). Masson’s trichrome ×200.

