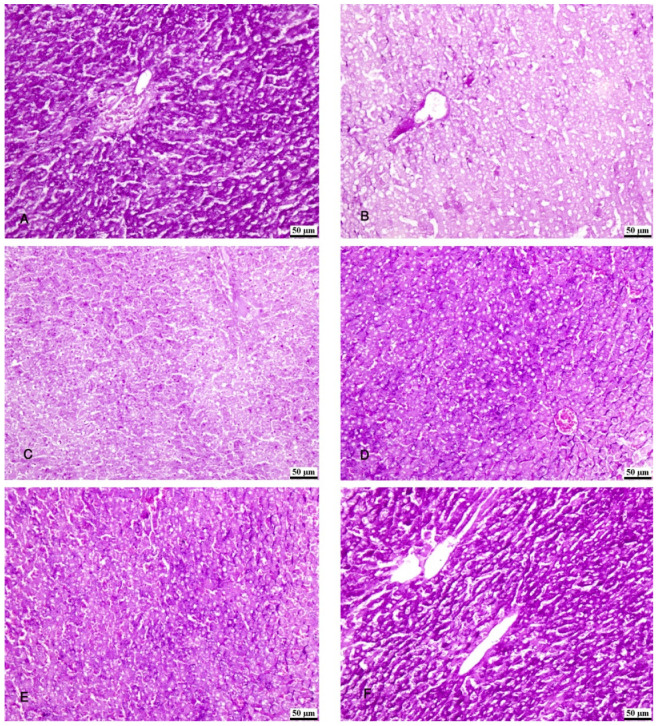
Figure 7.
Photomicrographs of the liver tissue. (A) Group IV shows normal PAS-stained hepatic parenchyma. (B) Group II shows a marked decrease in PAS-stained hepatic lobules. (C) Group III shows a decrease in PAS-stained hepatic lobules. (D,E) Groups IV and V show an increase in PAS-stained hepatic lobules. (F) Group VI shows normal PAS-stained hepatic lobules. PAS ×200.

