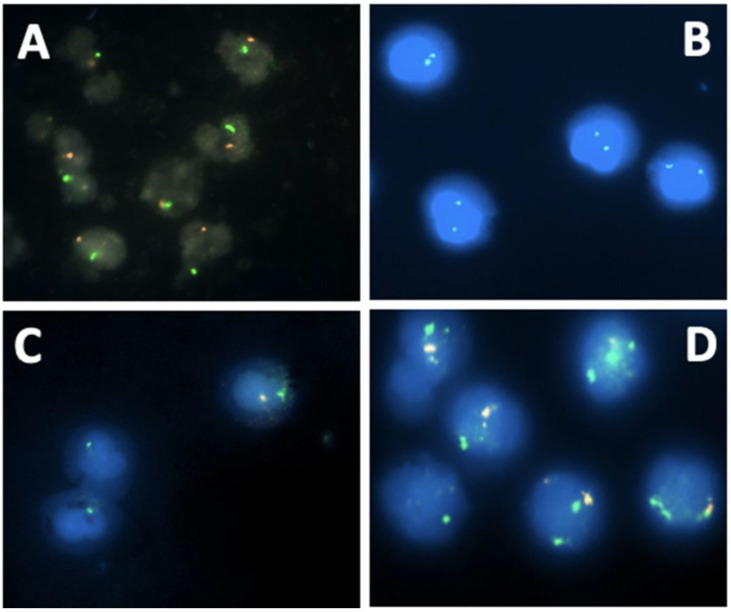
Figure 2.
DSDs profiles using molecular cytogenetics with specific probes for SRY (red signal) and X centromere (green signal) (A) Normal FISH signals of a male DSD patient (one green signal and one red signal); (B) Normal FISH signals of female DSD patient (two green signals); (C) Mosaic male Turner syndrome. Two cell populations: one with a red signal (appears whitish) and a green signal, and the other with only a green signal due to the loss of the Y chromosome; (D) Mosaic Klinefelter syndrome. Two cell populations: one with one green signal and one red signal (normal cells) and the second cell population with two green signals and one red signal.

