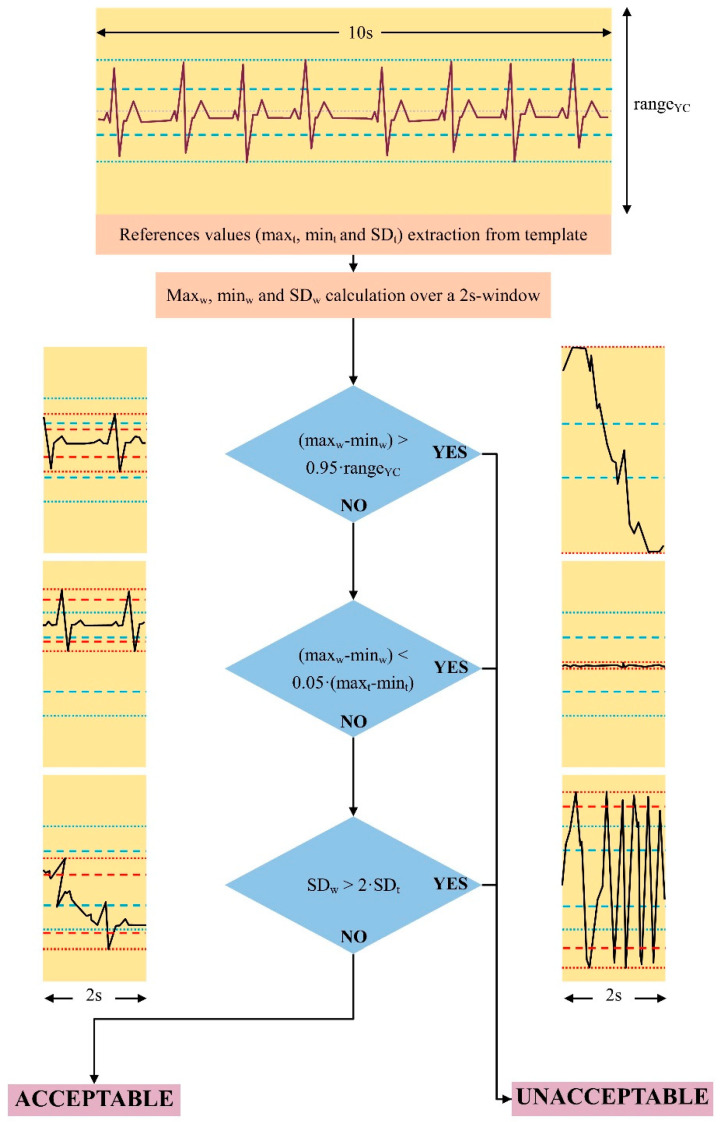
Figure 2.
Schematic view of the proposed algorithm. References values are extracted from a stable period of at least 10 s. Then, the algorithm is applied to consecutive ECG 2 s windows, and maximum, minimum, and SD values are extracted. In the first step, the range of variability of the signal (maxw–minw) is compared with the ADC range of the wearable device (rangeYC). If the signal saturates, it is classified as unacceptable. Then, the algorithm verifies and rejects the signal if ECG is absent or with a negligible amplitude. The last step compares the SD of the 2 s windows and the reference template. The signal is classified as unacceptable if the SDw is higher than twice the SDt. On the right, some examples of “bad” signals are shown. On the left, some examples of “good” signals are reported. If the ECG is present, even if the baseline is not comparable with the baseline of the reference template, the signal is considered acceptable (blue dotted line: maximum and minimum values of the reference signals; blue dashed lines: mean ± SD of the reference signal; red dotted line: maximum and minimum values of the 2 s window; red dashed lines: mean ± SD of the 2 s window; yellow boxes’ height: ADC range).

