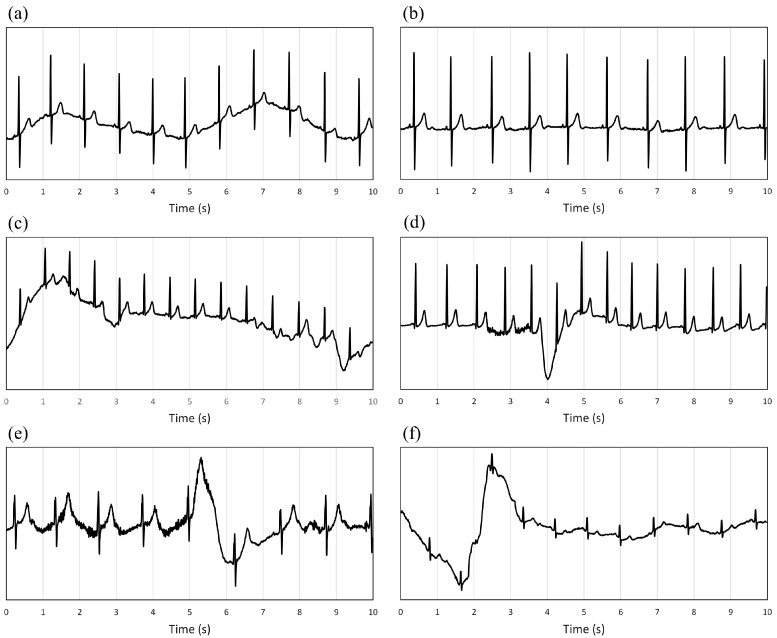
Figure 3.
(a–f): Examples of samples classified as acceptable by the expert cardiologists (the y-scale is different for each plot to make the signal morphology more readable and precise). Classifications were made with a time resolution of a cardiac beat and then reported on 10 s windows considering the predominant type. The consequence is visible in the (c–f) plots, where the sample was classified as acceptable despite a few seconds of signal with significant oscillations in the isoelectric line.

