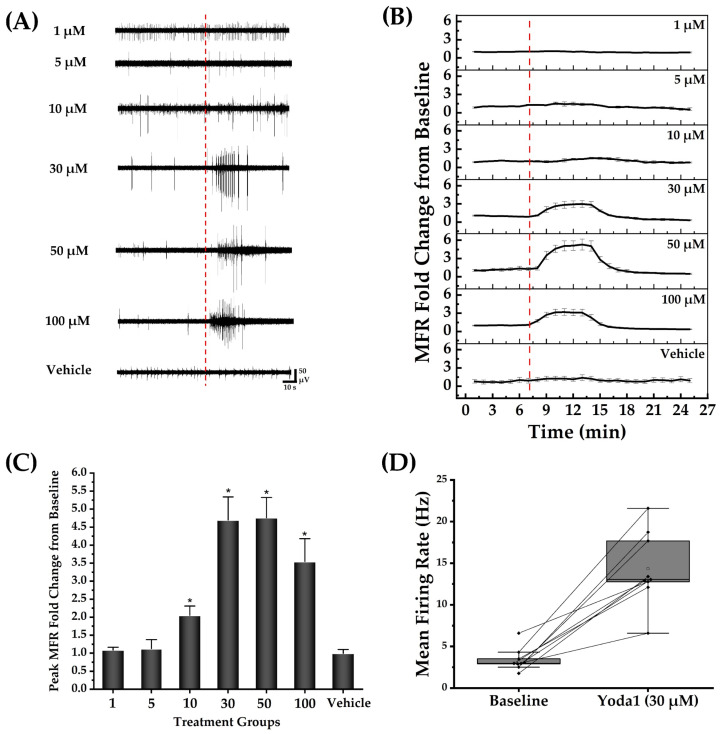
Figure 4.
Yoda1 transiently enhanced the mean firing rate of the neuronal networks. A total of 105 viable cells were seeded per cultured network. The number of cultured networks for each concentration represented in (B,C) is as follows: 1, 5, 50, and 100 µM (n = 4 networks); 10 µM (n = 10 networks); 30 µM (n = 9 networks); and vehicle (DMSO control, n = 3 networks). (A) Representative electrode raw voltage traces showing the transient elevation of spike activity after exposure to different concentrations of Yoda1 but not the largest concentration of vehicle (DMSO control). The red dotted line indicates the Yoda1 and DMSO (vehicle) administration time points. (B) Normalized MFR versus time for the Yoda1 treatment groups and control. The time corresponding to Yoda1 and DMSO (vehicle) administration is represented by the red dotted line. (C) Peak fold change in MFR from the baseline for each of the Yoda1 concentrations and vehicle. The results of the paired t-test showed a significant increase in MFR from the baseline in the groups treated at 10, 30, 50, and 100 µM of Yoda1. No significant change was identified in the lower concentrations of Yoda1 and the largest concentration of DMSO (vehicle). * indicates a statistically significant difference at p < 0.05. (D) Box plot illustrating the effect of 30 µM of Yoda1 on activity of nine representative neuronal networks.

