Figure 7.
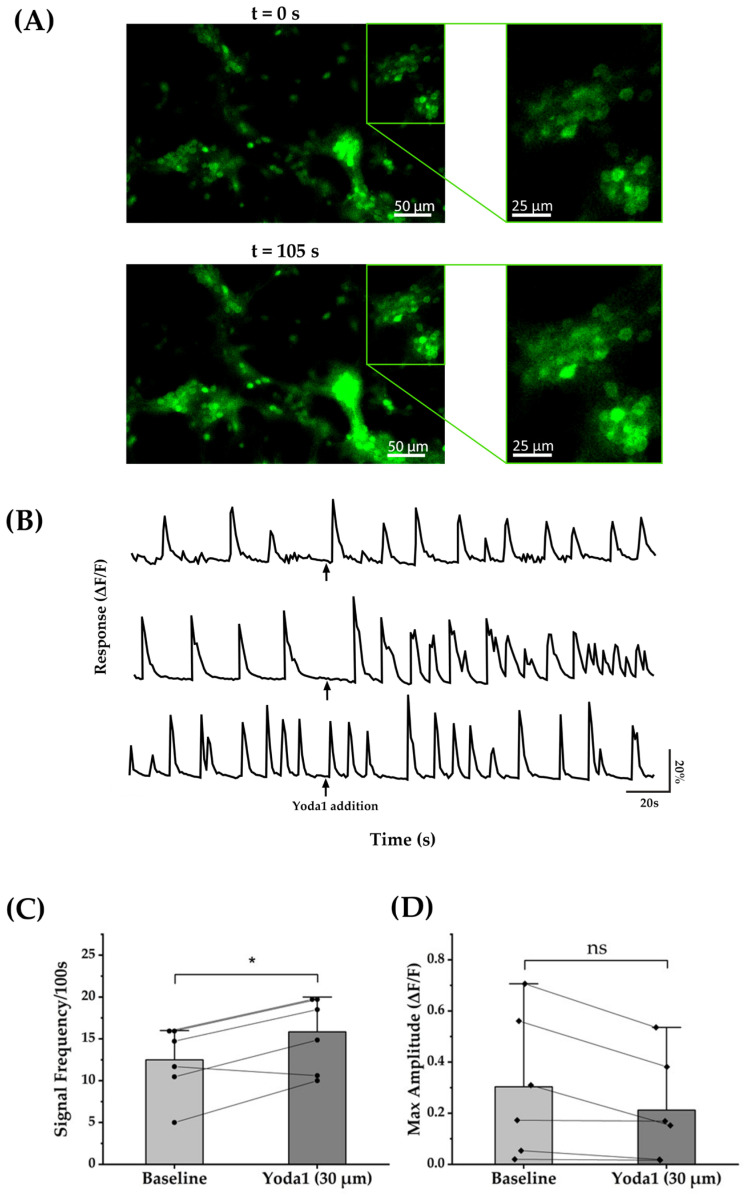
Yoda1 increased the frequency of calcium transient in cortical cells. (A) Fluorescence intensity images representing the intracellular calcium concentration in neuronal cells before (t = 0 s) and after (t = 105 s) application of Yoda1. (B) Time-dependent average fluorescence intensity relative to the baseline (ΔF/F) for three representative wells showing an increase in the rate of spontaneous calcium transients with exposure to Yoda1. (C) Comparison of the rate of calcium transients between the 100 s baseline and 100 s post-exposure to Yoda1 demonstrates a statistically significant increase at a level of p < 0.05. Circles depict values from six separate wells. (D) The peak amplitude of the calcium transients 100 s before and 100 s after Yoda1 treatment did not show any significant difference (ns). Analysis was conducted on six separate wells, each containing approximately 25 × 104 viable cells. Each diamond represents the value obtained from one of the six wells. * indicates a statistically significant difference at p < 0.05.

