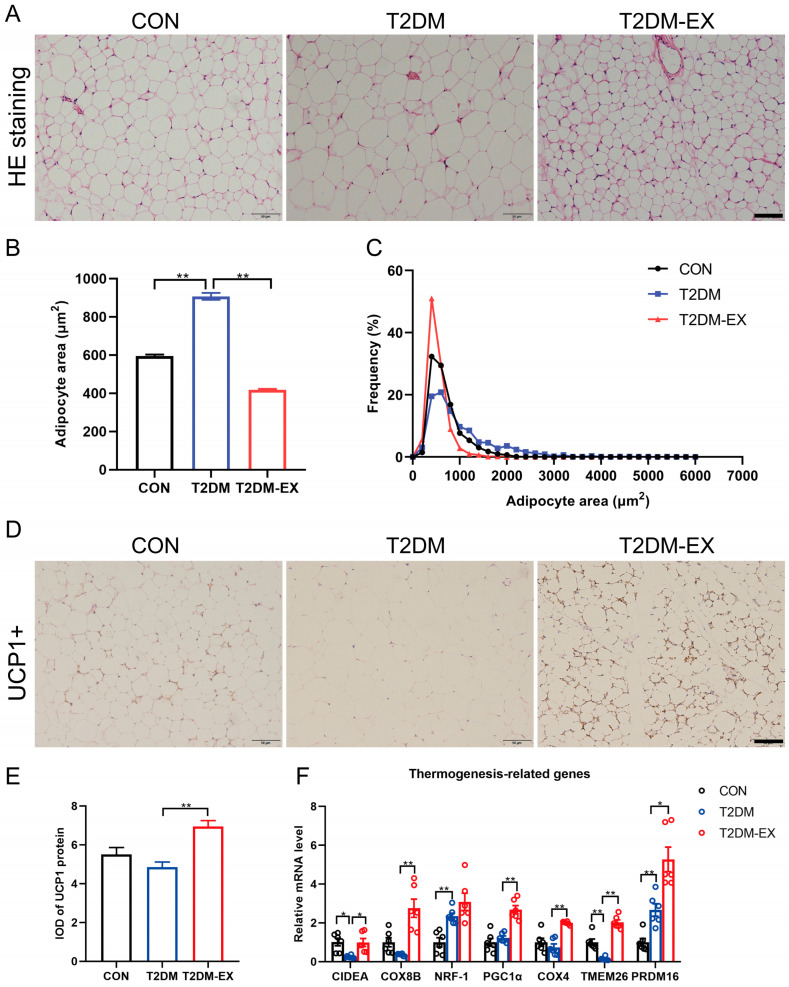
Figure 3.
The effects of exercise intervention on browning-related markers. (A) Representative images of iWAT with hematoxylin and eosin staining of histological sections from control, T2DM, and T2DM-EX mice. (B,C) Analysis of adipocyte size and frequency of distribution in HE-stained sections by ImageJ. Three samples per group, 6 fields per section, minimum 80 cells counted per image. (D,E) Representative images of UCP1 immunohistochemical staining of iWAT in control, T2DM, and T2DM-EX mice and their integrated optical density (IOD) value statistics. Three samples per group, 6 fields per section. (F) Thermogenesis gene expression in iWAT, n = 6 per group. * p < 0.05, ** p < 0.01. Scale bar = 50 μm; data are expressed as mean ± SEM.

