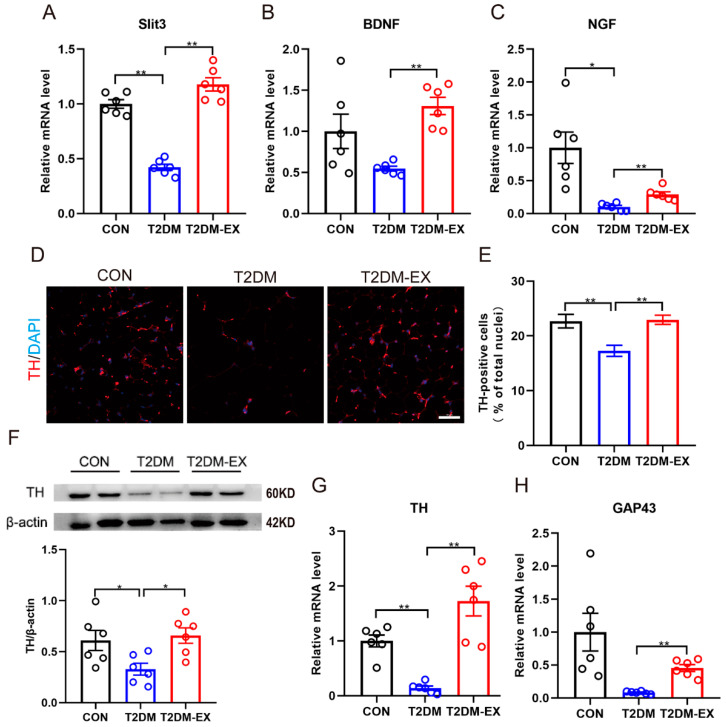
Figure 6.
The effects of exercise and T2DM on local sympathetic nerves in iWAT. (A–C) The mRNA expression levels of Slit3, BDNF, and NGF. (D) Representative images of TH immunofluorescence staining of iWAT in control, T2DM, and T2DM-EX mice, scale bar = 50 μm. (E) Ratio of the number of TH-positive cells to the number of DAPI-stained nuclei. Three samples per group, 6 fields per section. (F) TH protein expression was analyzed by Western blot and quantified using ImageJ in iWAT collected from CON, T2DM, and T2DM-EX group mice. n = 6 per group. (G,H) The mRNA expression levels of TH and GAP43, n = 6 per group. * p < 0.05, ** p < 0.01. Data are expressed as mean ± SEM. Original images of (F) can be found in Supplementary Materials.

