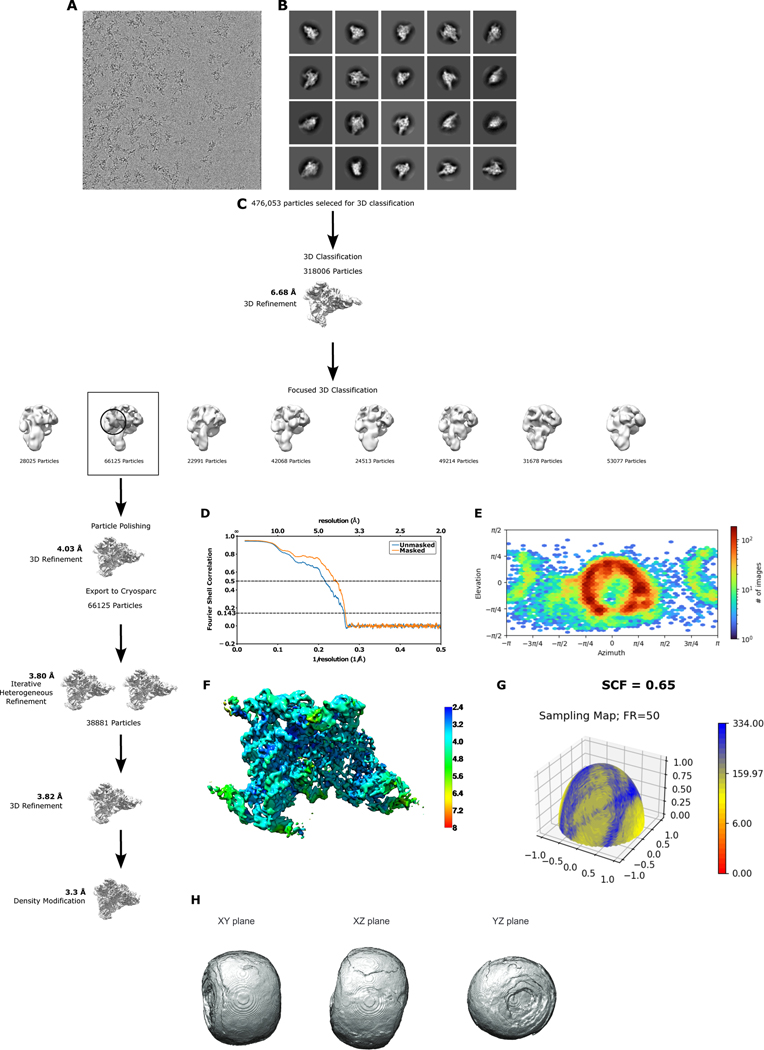
Extended Data Fig. 3. Cryo-EM data processing and validation.
a. Example micrograph. b. Initial 2D class averages. c. Data processing workflow highlighting all relevant steps. d. Fourier Shell Correlation (FSC) curves for cross-validation between the map and model of the pre-branching group II intron. e. Euler angle distribution plot showing the orientations of particles used in the reconstruction. f. Local resolution map of the pre-branching group II intron map (map made in UCSF Chimera). g. Surface sampling plot of the Fourier sampling, with SCF value shown. h. 3D FSC shown as an isosurface at a threshold of 0.5 with three perpendicular planar views.

