
Figure 2.
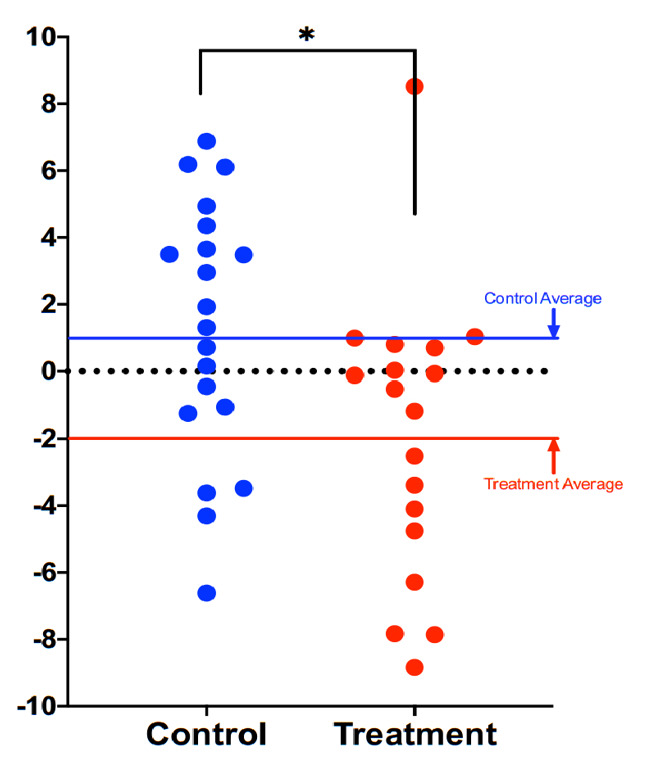
Comparison of DNAmAge change between treatment and control groups. Each dot is a subject, and the vertical axis represents difference in DNAmAge from the beginning to the end of the eight-week term. Those in the treatment group (n = 18) scored an average 2.04 years younger at the end of the program, measured by the Horvath DNAmAge clock, as compared to the same individuals at the beginning (p = 0.043 for within group change). Control participants scored an average of 1.10 years older at the end of the study period (p = 0.191). The difference between control and treatment groups was significant at the level p = 0.018 (unpaired two-tailed t-test). Long red and blue lines represent group averages (mean).