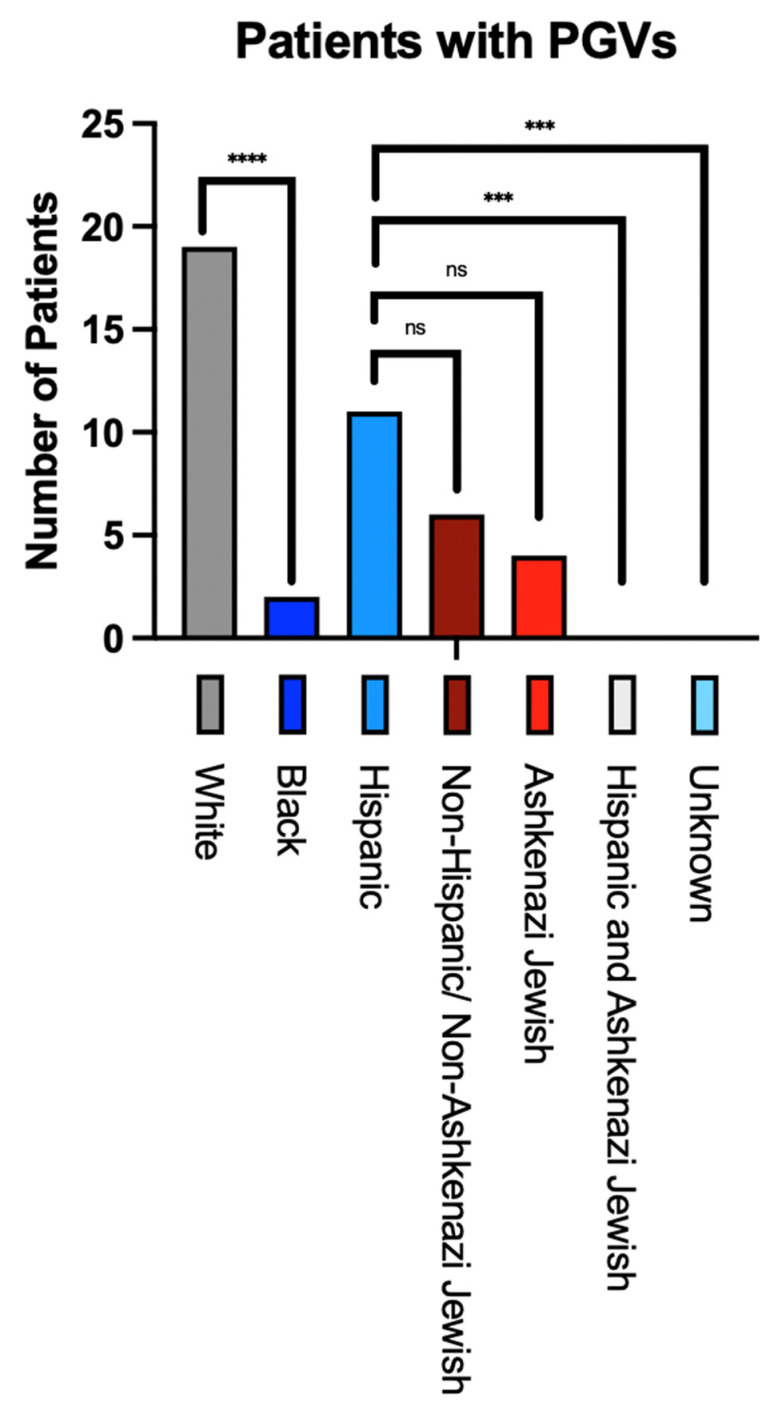
Figure 1.
Number of patients with iPGVs, and statistical significance of detecting iPGVs according to predominant racial or ethnic sub-groups within our cohort. This Figure demonstrates the absolute number of patients per demographic group with iPGVs detected in our cohort and compares the statistical likelihood that variations in prevalence exist among racial or ethnic sub-groups. **** = statistically significant racial finding; *** = statistically significant ethnic finding; ns = not statistically significant.

