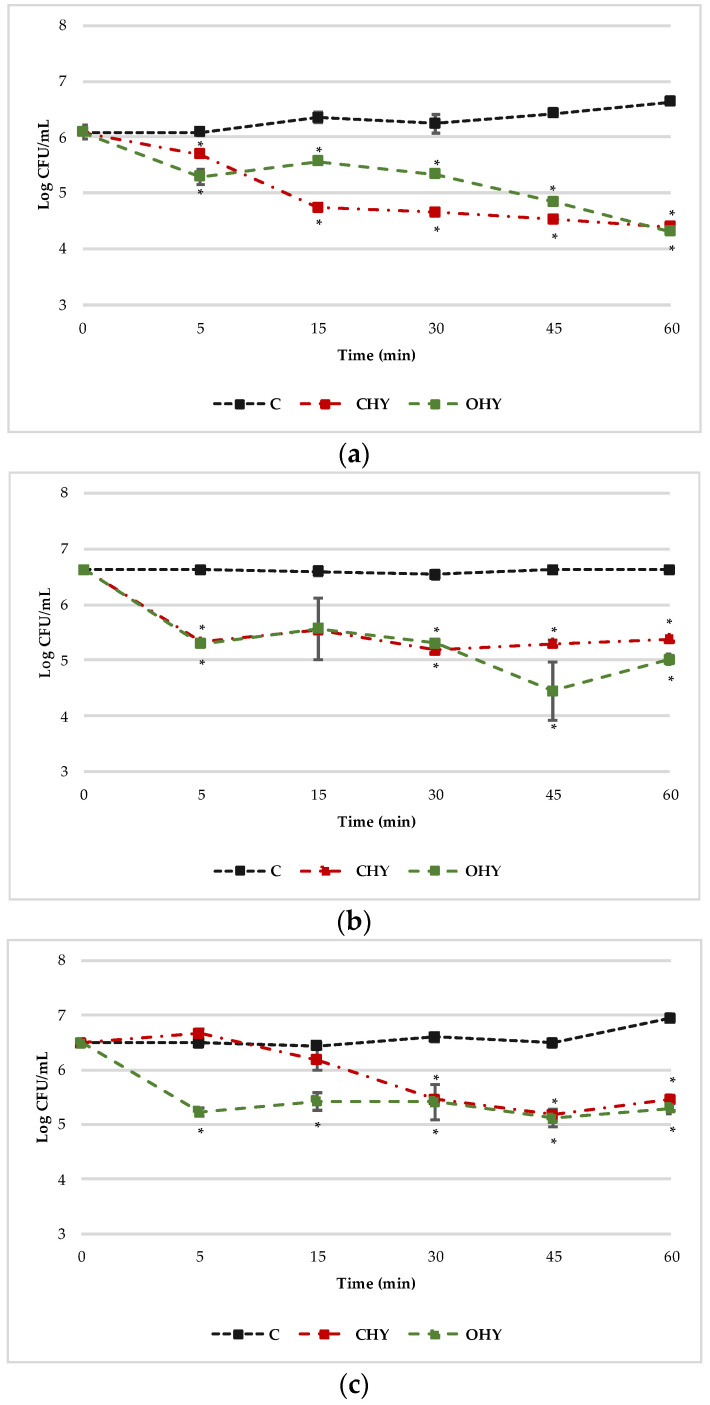
Figure 1.
TKK curves of CHY and OHY at MICs (125 µL/mL for ATCC 19114, 250 µL/mL for LM6, and 500 µL/mL for L3) against L. monocytogenes ATCC 19114 (a), LM6 (b), and L3 (c). Results are expressed as the average of three replicates and the bars represent the standard deviations. The asterisks indicate a statistically significant difference (* p < 0.05) between control and the treatments for each analysis time. CHY, C. capitatus hydrolate; OHY, O. hirtum hydrolate.

