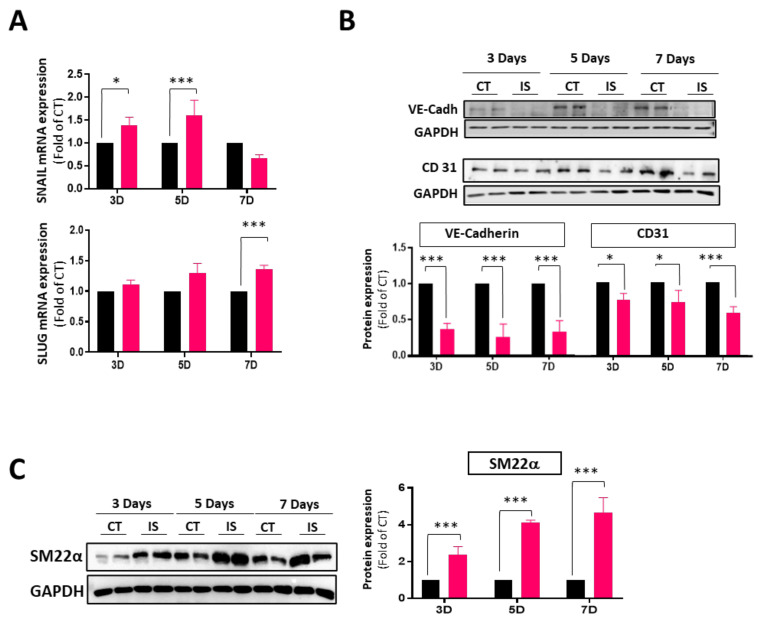
Figure 2.
IS induces endMT in hVECs. Cells were exposed to IS 250 μM or PBS for 3, 5, and 7 days. Subsequently, cells were collected for analyses of mRNA and protein expression. (A) RT-qPCR of CT- and IS-treated hVEC extracts showing mRNA expression of Snail and Slug. (* p < 0.01; *** p < 0.0001; n = 3); (B) Western blot analysis and quantification of endothelial markers (VE-Cad and CD31) in hVECs. Experiments were performed in duplicate (* p < 0.01; *** p < 0.001; n = 3); (C) Immunoblot analysis and quantification of mesenchymal marker SM22α in hVECs (*** p < 0.001; n = 3). Black bar (CT) and red bars (IS). Experiments were performed in duplicate.

