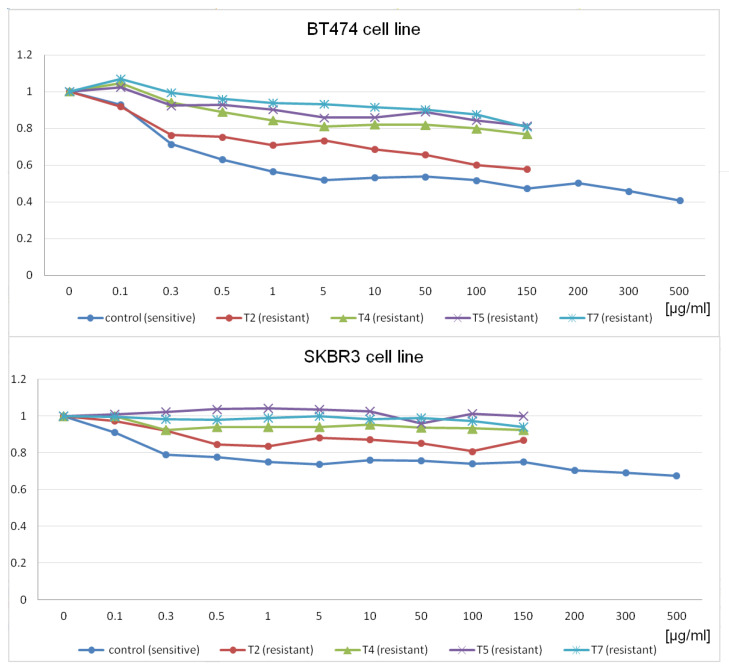
Figure 2.
Diagrams presenting changes in proliferation rates at different time points of the experiment during the whole time of cell exposure to trastuzumab. The charts represent the relationship between drug dose (“[g/mL]”axis) and proliferation intensity (y-axis) presented as a decimal fraction of the proliferation of drug-treated cells compared to the control untreated cells and are based upon proliferation assay measurements, with each curve corresponding to a particular time point. “Control” means cells purchased from ATCC and confirmed to be trastuzumab sensitive and able to develop resistance. Control cell lines were not treated with the drug at any time in the experiment and reaction for the drug was stable. T2, T4, T5, and T7 were treated at for 2, 4, 5, and 7 months, respectively. The time points were selected based on the significant increase in proliferation rates (decreased reaction for the drug) to the previous month, reflecting a gradual development of resistance to trastuzumab.

