Figure 2.

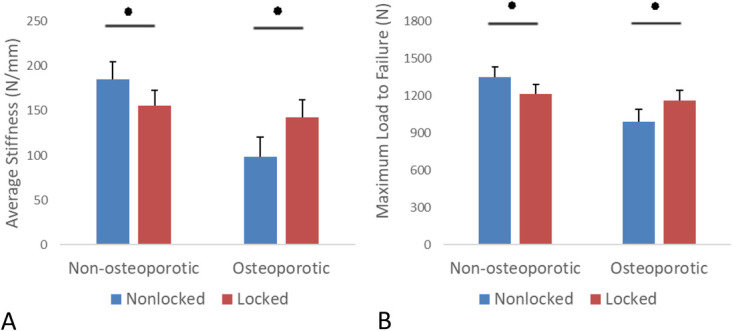
Average stiffness (A) and maximal load to failure (B) of nonosteoporotic and osteoporotic samples. Error bars represent 95% confidence interval. *P < 0.05.

Average stiffness (A) and maximal load to failure (B) of nonosteoporotic and osteoporotic samples. Error bars represent 95% confidence interval. *P < 0.05.