Figure 3.

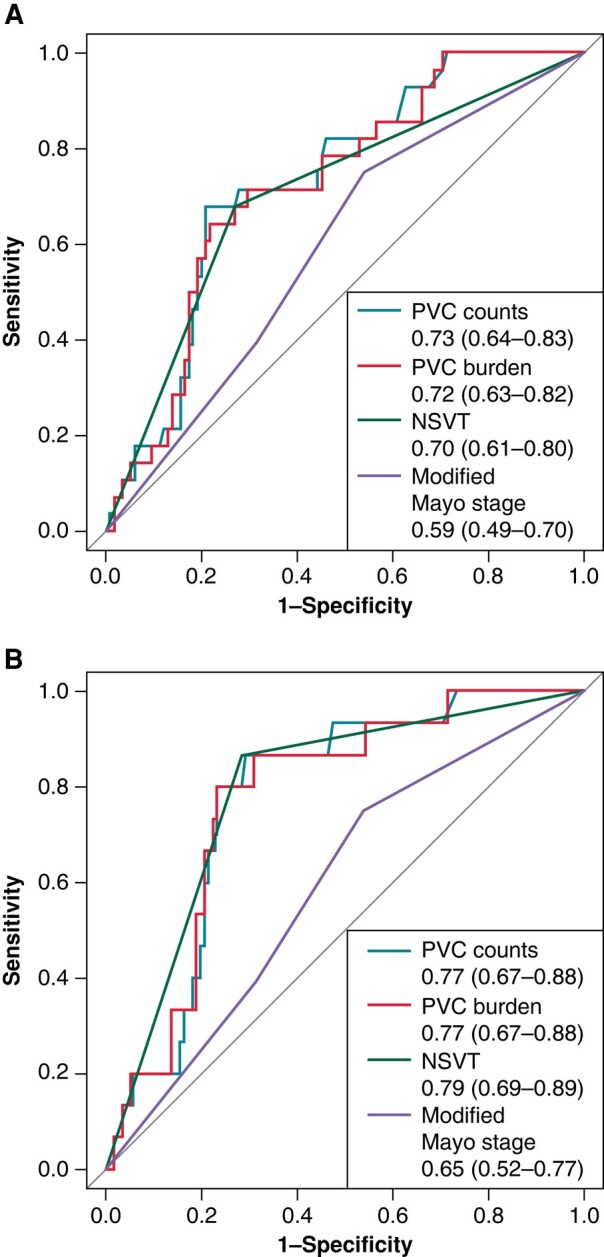
ROC curves for predicting adverse VA/SCD. Note: The AUC presented the accuracy of PVC, NSVT and Mayo stage of predicting presence of adverse VA/SCD (A) and new-onset of adverse VA/SCD during follow-up (B).

ROC curves for predicting adverse VA/SCD. Note: The AUC presented the accuracy of PVC, NSVT and Mayo stage of predicting presence of adverse VA/SCD (A) and new-onset of adverse VA/SCD during follow-up (B).