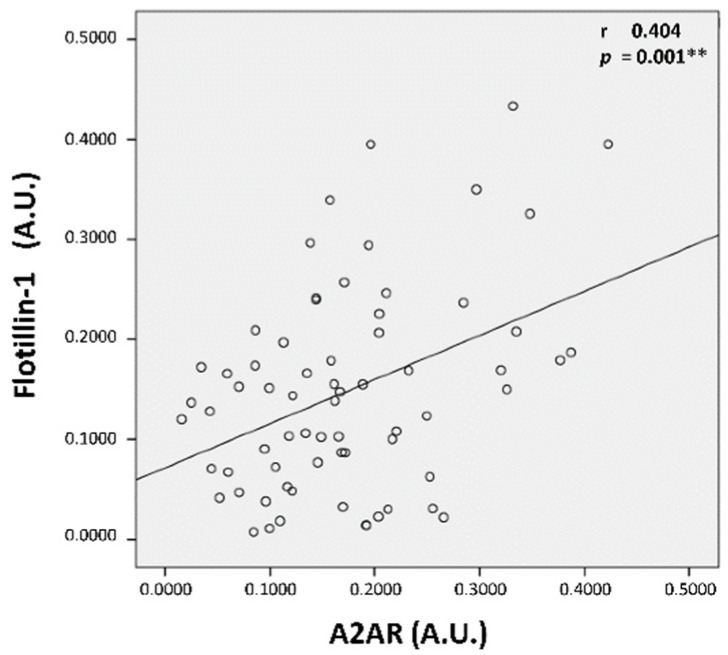
Figure 3.
Positive correlation between A2AR and Flotillin-1 expression in all individuals. A2AR and Flotillin-1 expression levels (in A.U.) were positively correlated for the whole participant group. Pearson’s r coefficient of correlation and the coefficient of determination r2 were used for the correlation study, p ≤ 0.001 considered significant (**).

