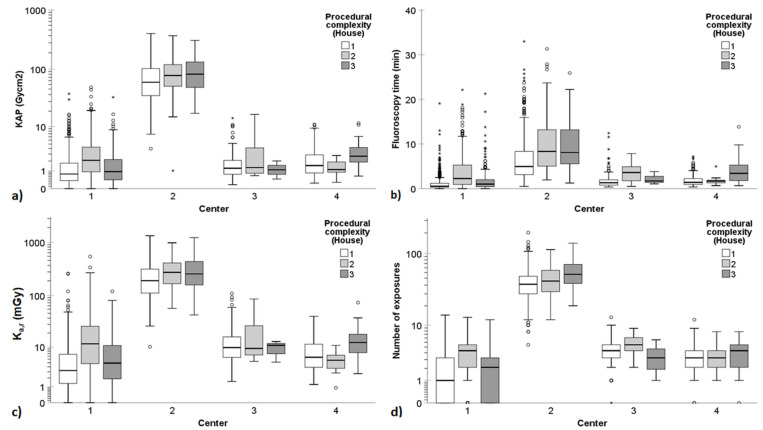
Figure 2.
Patient radiation exposure quantities in all ERCP procedures (thus, containing data both from non-PSC and PSC procedures) according to the 3-point HOUSE complexity grading scale. (a) KAP, (b) fluoroscopy time, (c) Ka,r, and (d) number of exposures varied significantly between the participating centers. A logarithmic scale is used on the y-axis for KAP, Ka,r, and number of exposures to better delineate the changes at low dose levels and low number of exposures. In the boxplots, circles and asterisks denote outliers and extreme cases, respectively. Outliers are defined as data points that fall beyond 3 standard deviations from the mean. Extreme cases are identified as data points lying outside of 1.5 times the interquartile range above the third quartile or below the first quartile in the boxplot.

