Figure 4.
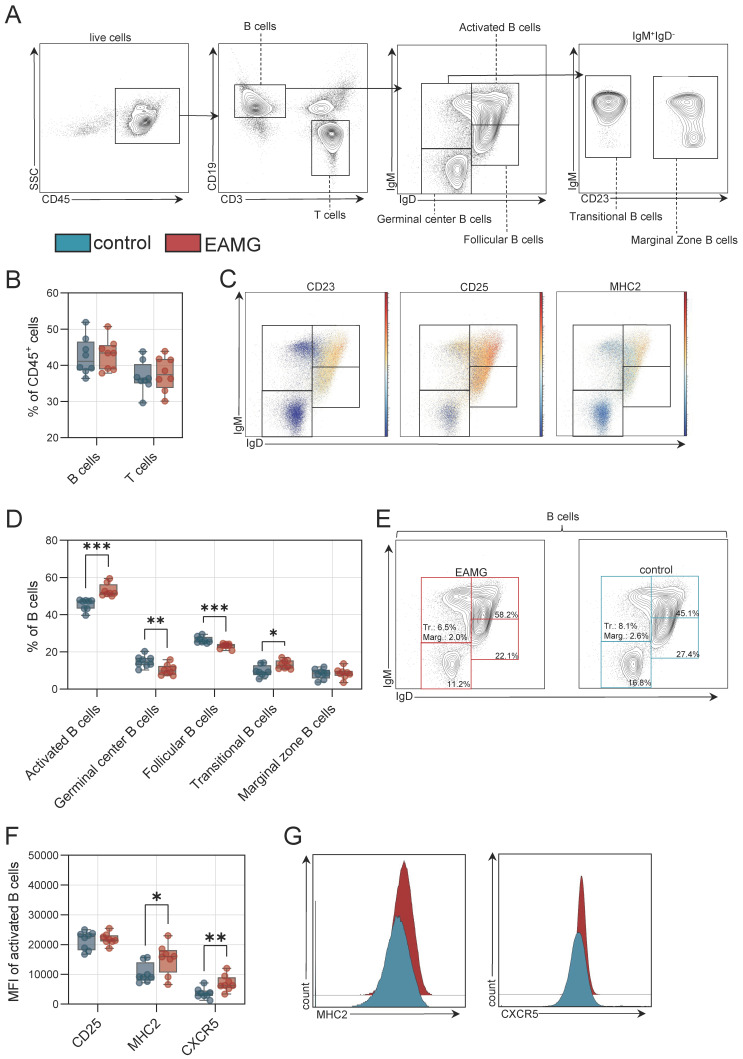
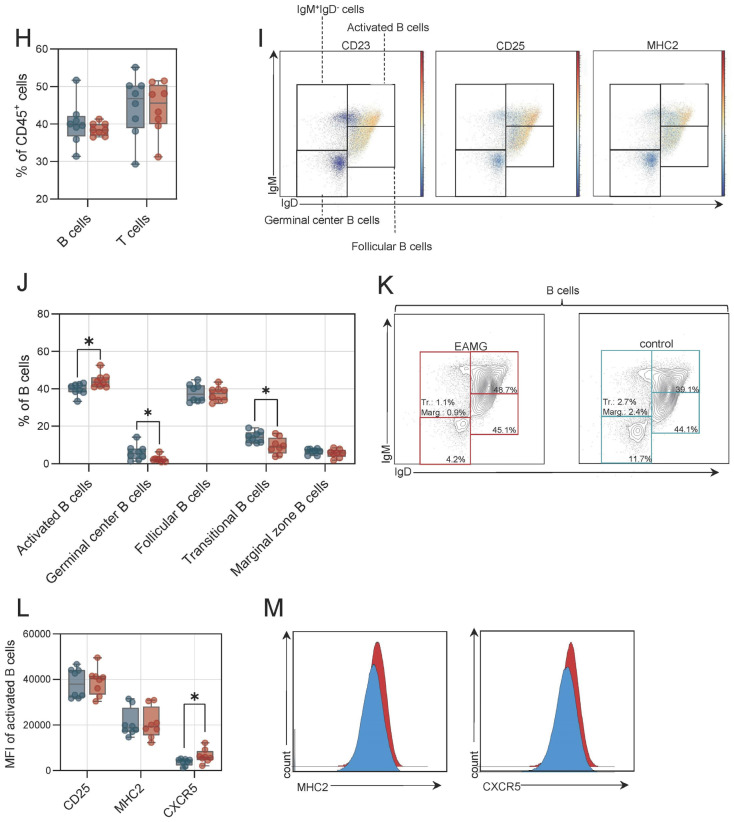
B cell pathology in experimental autoimmune myasthenia gravis in the spleen and in draining lymph nodes. (A): Representative gating for B cells and B cell subgroups. Live cells were identified by live/dead marker. (B): Frequency of B and T cells in the spleen of experimental autoimmune myasthenia gravis (EAMG) mice and controls. N = 8 per group. (C): Representative gating for CD23, CD25 and major histocompatibility complex (MHC2). Red indicates high expression; blue indicates low expression for each cell. (D): Frequencies of B cell subgroups in the spleen. (E): Representative gating for B cells of EAMG mice and controls. (F): Median fluorescence intensity (MFI) of CD25, MHC2 and CXCR5 (CD185). (G): Representative histograms for EAMG mice (red) and controls (blue) for MHC2 and CXCR5. (H): Frequency of B and T cells in the abdominal lymph nodes of experimental autoimmune myasthenia gravis (EAMG) mice and controls. N = 8 per group. (I): Representative gating for CD23, CD25 and major histocompatibility complex (MHC2). Red indicates high expression; blue indicates low expression for each cell. (J): Frequencies of B cell subgroups in lymph nodes. (K): Representative gating for B cells of EAMG mice and controls. (L): Median fluorescence intensity (MFI) of CD25, MHC2 and CXCR5 (CD185). (M): Representative histograms for EAMG mice (red) and controls (blue) for MHC2 and CXCR5. Groups were compared by unpaired Student’s t-test. p ≤ 0.05 *, p < 0.01 **, p < 0.001 ***, p > 0.05 not significant.


