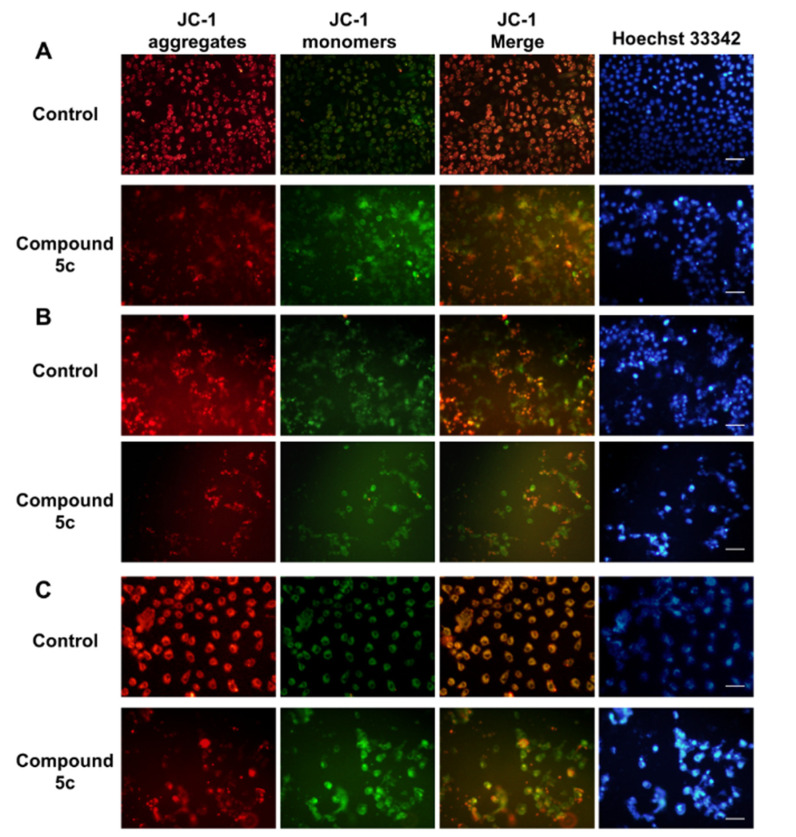
Figure 5.
Impact of compound 5c on mitochondrial membrane potential: Representative fluorescence images in the (A) MDA-MB-231 cell line, (B) MCF-7 cell line, and (C) HepG2 cell line. Red fluorescence represents JC-1 aggregates in healthy mitochondria, whereas green fluorescence represents JC-1 monomers, indicating mitochondrial membrane potential dissipation. Merged images represent co-localization of the JC-1 aggregates and JC-1 monomers. Hoechst 33342 indicated the nuclear location and morphological changes. Bar = 20 μM.

